
 After Its 179% One Year Surge?")
Find your next quality investment with Simply Wall St’s easy and powerful screener, trusted by over 7 million individual investors worldwide.
Wondering whether AST SpaceMobile at around US$70.68 is offering genuine value or just eye catching returns? This article breaks down what that current price really implies.
The stock has been volatile lately, with a 1.2% gain over the last 7 days, a 25.5% decline over the last 30 days, a 15.3% decline year to date, and a very large 179.1% return over the past year.
Those swings sit against a backdrop of ongoing interest in satellite enabled mobile connectivity and investor focus on how AST SpaceMobile might fit into that theme. Recent coverage has centered on the potential scale of the addressable market and the capital required to pursue it. This helps explain why sentiment and the share price have moved around.
Simply Wall St’s valuation checks give AST SpaceMobile a score of 2 out of 6. The sections that follow will compare different valuation approaches before circling back to an even more complete way to think about what this stock could be worth.
AST SpaceMobile scores just 2/6 on our valuation checks. See what other red flags we found in the full valuation breakdown.
Approach 1: AST SpaceMobile Discounted Cash Flow (DCF) Analysis
A Discounted Cash Flow, or DCF, model takes estimates of a company’s future cash flows and discounts them back to today’s dollars to arrive at an intrinsic value per share. It is essentially asking what those future cash flows are worth right now.
For AST SpaceMobile, the model used is a 2 Stage Free Cash Flow to Equity approach, based on cash flow projections in $. The latest twelve month free cash flow is a loss of about $1.44b. Analyst inputs go out to 2030, with free cash flow for that year projected at $975.6m, and Simply Wall St extrapolates further amounts beyond the explicit analyst period.
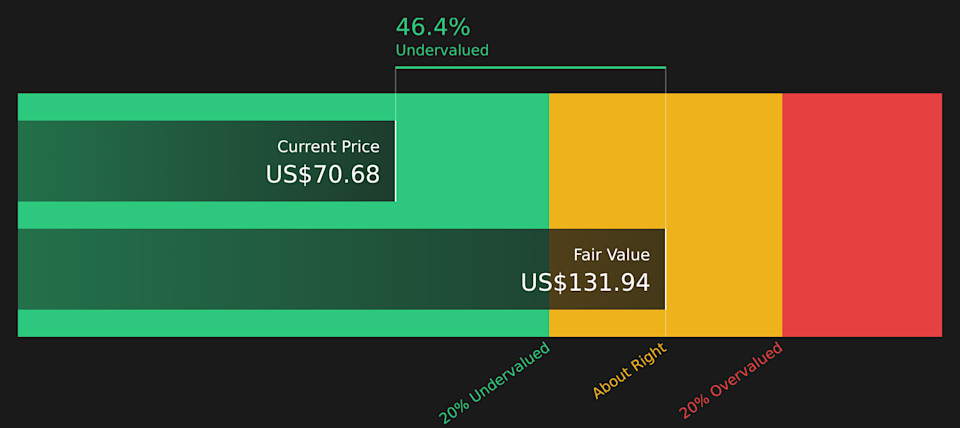
Bringing all those projected cash flows back to today using a discount rate gives an estimated intrinsic value of about $131.94 per share for AST SpaceMobile. Against the current share price of roughly $70.68, the DCF output suggests the stock trades at a 46.4% discount to this estimate, indicating a material gap between price and modelled value.
Result: UNDERVALUED (per this DCF model)
Our Discounted Cash Flow (DCF) analysis suggests AST SpaceMobile is undervalued by 46.4%. Track this in your watchlist or portfolio, or discover 44 more high quality undervalued stocks.
 ASTS Discounted Cash Flow as at May 2026
Approach 2: AST SpaceMobile Price vs Book
For companies that are still building toward consistent profitability, the price to book, or P/B, ratio is often more useful than earnings based multiples, because it focuses on how the market values the balance sheet rather than current profits. In general, higher growth potential and lower perceived risk can support a higher P/B ratio, while lower growth expectations or higher risk usually point to a lower, more conservative level.
AST SpaceMobile currently trades on a P/B of about 11.23x. That sits well above the Telecom industry average P/B of 1.52x and also above the peer group average of 10.84x. To go a step further, Simply Wall St uses a proprietary “Fair Ratio” for the preferred multiple, which is the P/B level that could be expected given factors such as earnings growth, industry, profit margin, market cap and specific risks for the company.
This Fair Ratio framework can be more informative than a simple comparison with peers or the industry, because it adjusts for the mix of growth, risk, profitability, sector and size that is unique to each company. In AST SpaceMobile’s case, the Fair Ratio is not available, so it is not possible to say whether the current 11.23x P/B suggests the stock is overvalued, undervalued or about right on this measure.
Result: ABOUT RIGHT
 NasdaqGS:ASTS P/B Ratio as at May 2026
P/B ratios tell one story, but what if the real opportunity lies elsewhere? Start investing in legacies, not executives. Discover our 19 top founder-led companies.
Upgrade Your Decision Making: Choose your AST SpaceMobile Narrative
Earlier it was mentioned that there is an even better way to think about valuation. On Simply Wall St that means using Narratives, where you set out your story for AST SpaceMobile, link it to specific forecasts for revenue, earnings and margins, and let the platform translate that into a Fair Value that you can compare with the current price on the Community page. Each Narrative updates automatically when new information such as news or earnings is added. One investor might anchor on a Fair Value near US$25 to US$55 because of focus on cash burn and competition, while another might lean toward a higher figure around US$95 based on confidence in contracted revenue and constellation funding. You can see these different stories side by side to decide how closely they match your own view and whether the gap between price and Fair Value looks attractive or stretched.
For AST SpaceMobile, however, we will make it really easy for you with previews of two leading AST SpaceMobile Narratives:
On Simply Wall St, Narratives give you a structured way to test different stories against the same price. The bullish view leans heavily on early commercial traction and a large cash position, while the bearish view highlights capital intensity, competition and the gap between current pricing and analyst style fair values.
Here is how those two ends of the range look side by side.
🐂 AST SpaceMobile Bull Case
Fair value in this bullish narrative: US$95.00
Implied discount to this fair value at US$70.68: about 26%.
Revenue growth assumption: very large, around 400% a year.
Assumes AST SpaceMobile converts more than US$1b of contracted revenue, scales production toward over 100 satellites with over US$3.2b of liquidity, and benefits from partnerships that together reach nearly 3 billion mobile subscribers.
Models a shift from a current loss to earnings of about US$2.1b by around 2028, with profit margins moving sharply higher and the stock trading on a P/E of 18.8x, above the current 8.9x P/E cited for the US Telecom industry.
Flags meaningful execution and regulatory risks, including launch cadence, cost control, mobile operator adoption and spectrum access, and encourages readers to stress test these inputs before relying on a US$95.00 fair value.
🐻 AST SpaceMobile Bear Case
Fair value in this more cautious narrative: US$40.00 midpoint of a US$25.00 to US$55.00 range.
Implied premium to the US$40.00 midpoint at US$70.68: about 77%.
Revenue growth assumption: very large, around 335% a year.
Highlights a market value of about US$34.74b against revenue of US$70.9m, alongside levered free cash flow of about US$1.19b in the red and under two years of cash runway at the quoted burn rate.
Builds a bottom up case where revenue reaches US$3b by 2029 and EBITDA margin settles near 30%, which on a 15x multiple and a higher discount rate points to a US$25.00 to US$55.00 value range, well below some analyst targets.
Points to rising competitive pressure after Amazon’s Globalstar deal, potential dilution from future capital raises and execution risk around BlueBird deployments and carrier behavior, arguing the stock is priced for near perfect outcomes.
These Narratives show how the same set of facts can support very different conclusions. The useful part for you is not choosing a side, but deciding which assumptions feel more realistic for your own risk tolerance and time horizon, then checking how that compares with where the stock trades today.
To see how other investors are framing the story and where their fair values sit relative to yours, See what the community is saying about AST SpaceMobile.
Do you think there’s more to the story for AST SpaceMobile? Head over to our Community to see what others are saying!
NasdaqGS:ASTS 1-Year Stock Price Chart
This article by Simply Wall St is general in nature. We provide commentary based on historical data and analyst forecasts only using an unbiased methodology and our articles are not intended to be financial advice. It does not constitute a recommendation to buy or sell any stock, and does not take account of your objectives, or your financial situation. We aim to bring you long-term focused analysis driven by fundamental data. Note that our analysis may not factor in the latest price-sensitive company announcements or qualitative material. Simply Wall St has no position in any stocks mentioned.
Companies discussed in this article include ASTS.
Have feedback on this article? Concerned about the content? Get in touch with us directly. Alternatively, email editorial-team@simplywallst.com