
")
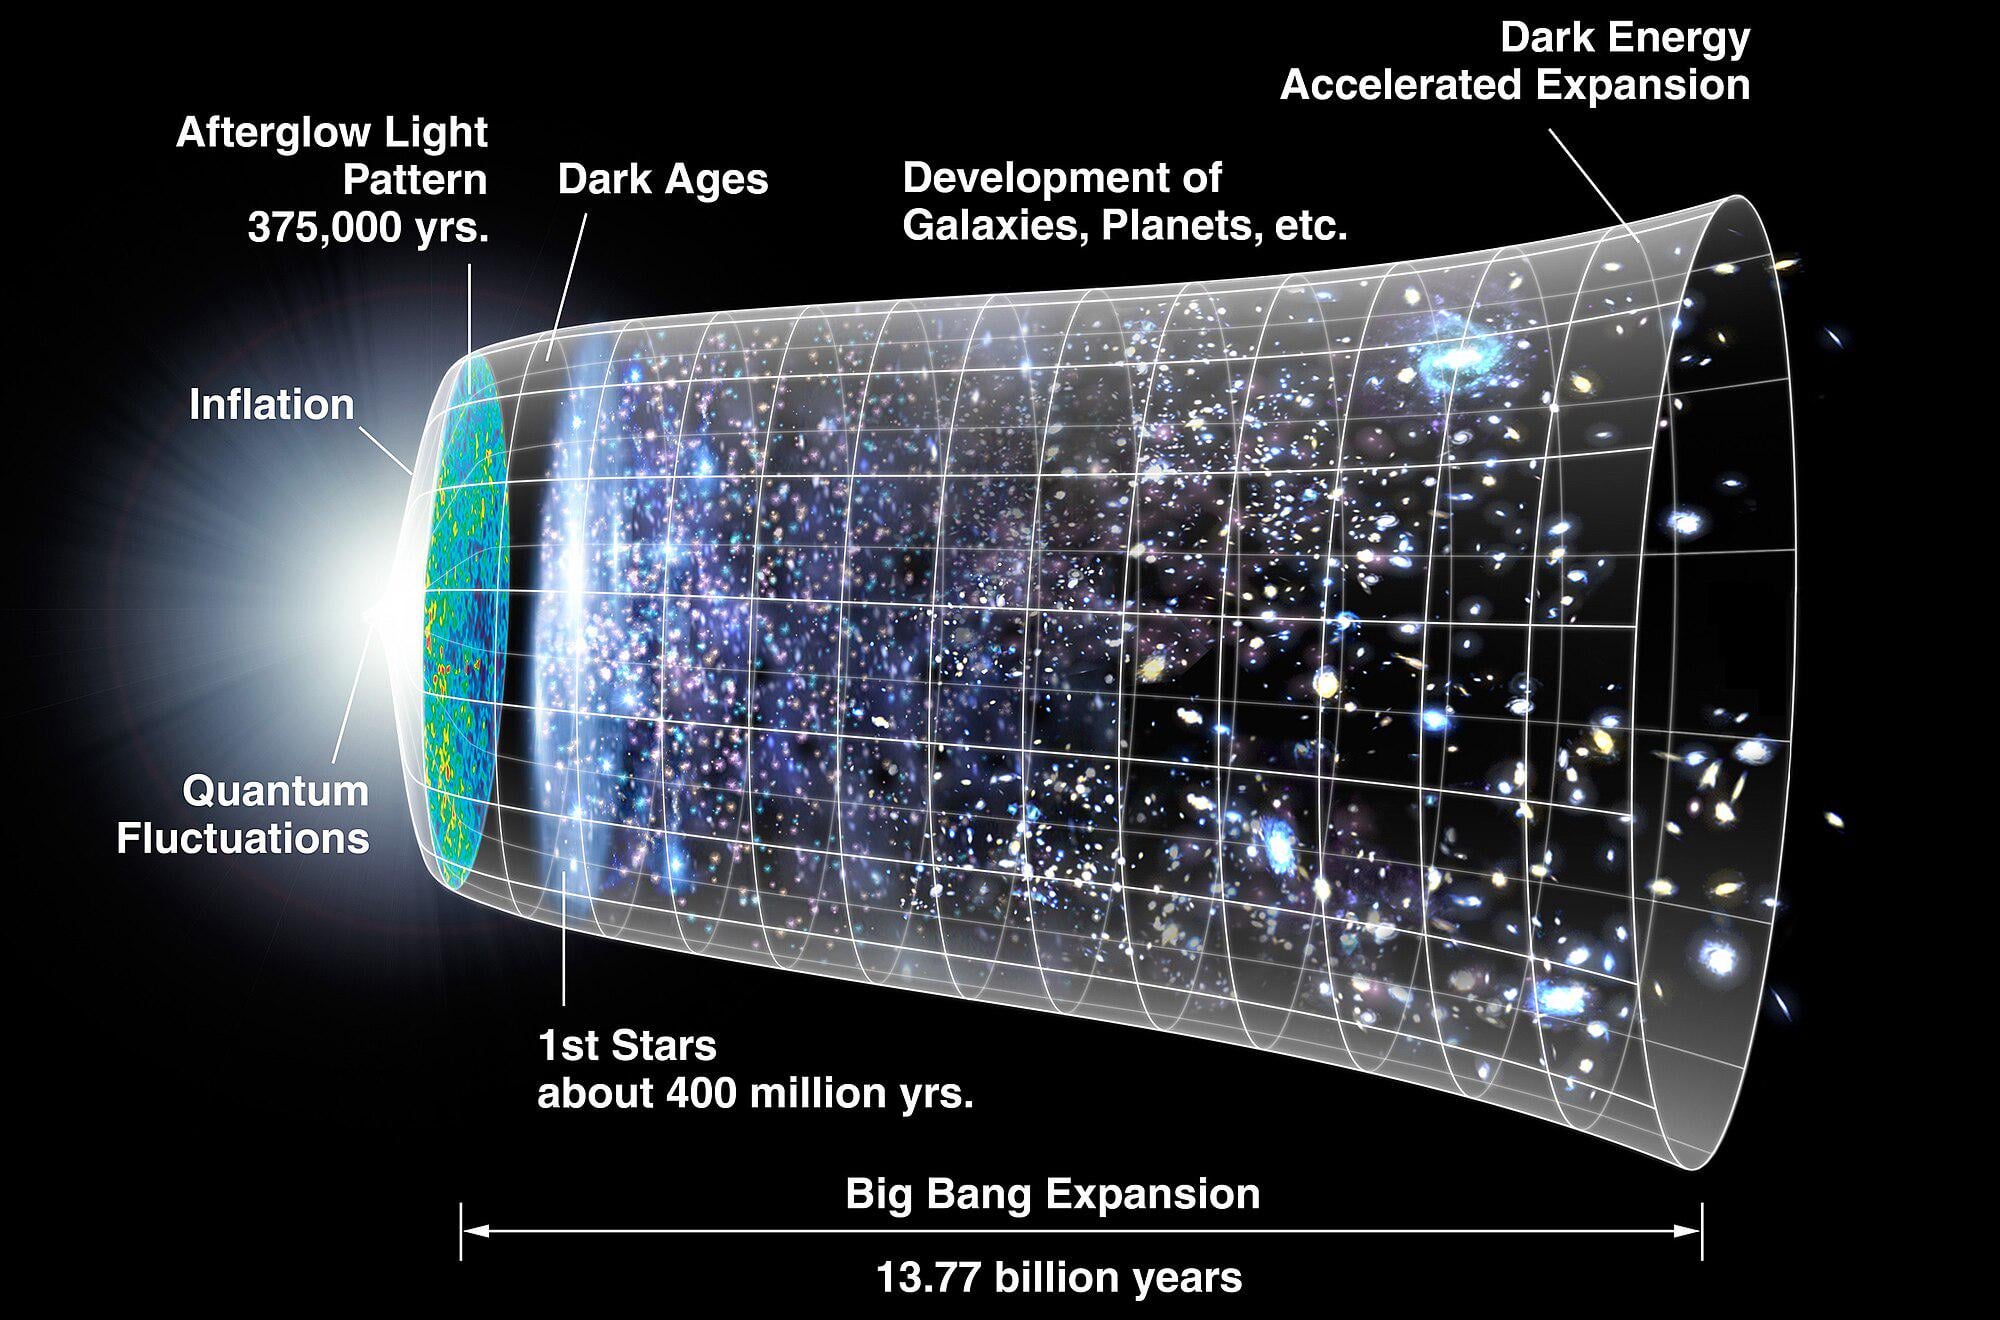
Timeline of the universe. A representation of the evolution of the universe over 13.77 billion years. The far left depicts the earliest moment we can now probe, when a period of "inflation" produced a burst of exponential growth in the universe. (Size is depicted by the vertical extent of the grid in this graphic.) For the next several billion years, the expansion of the universe gradually slowed down as the matter in the universe pulled on itself via gravity. More recently, the expansion has begun to speed up again as the repulsive effects of dark energy have come to dominate the expansion of the universe. The afterglow light seen by WMAP was emitted about 375,000 years after inflation and has traversed the universe largely unimpeded since then. The conditions of earlier times are imprinted on this light; it also forms a backlight for later developments of the universe.
by Due-Explanation8155
5 Comments
I know it’s not to scale, but I expected the cone shape to be much wider to better show the expansion. I might have missed something.
This is kind of like posting “2+2=4” in /r/math, but thank you for the reminder OP. It’s hard to forget. This is in every textbook.
I wonder how we look at this image in a 100 years, or 500. The things we discovered in the last 100 already blows my mind.
Thank you for this profound original insight 👍
Saw an interesting article today about how Prof Lee’s observations led to results that suggest dark energy (the force that is pushing galaxies away from each other) is weakening, therefore it is possible that it becomes so weak that gravity begins to pull the galaxies back together leading to a “Big Crunch”.
Strange times we are living in. To be able to know and understand concepts like these.