
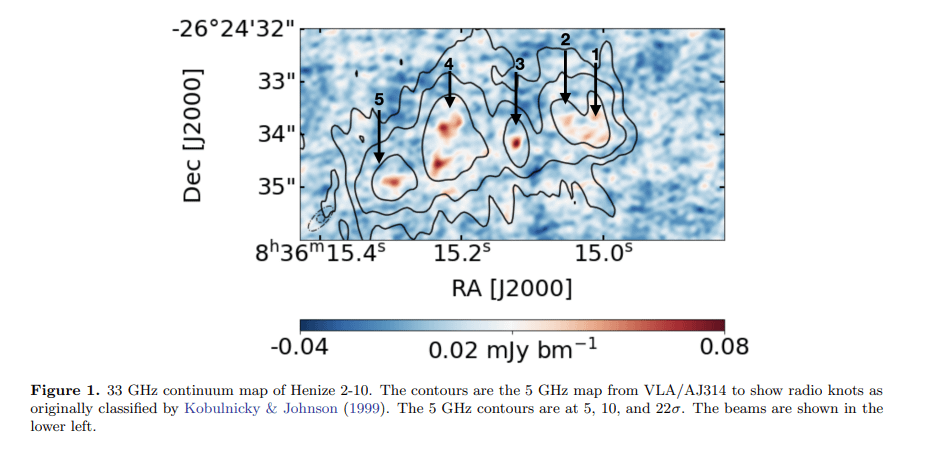
In many radio flux maps there are clear negative regions e.g. above from https://arxiv.org/pdf/2107.02695 – what do they mean?
S-matrix <psi\_f |U| psi\_i> says probability of photon exchange depends on both emitter in psi_i , but also absorber in psi_f. Positive telescope signal means pointing emitter in psi_i, so could pointing absorber in psi_f give such negative signals?
by jarekd
2 Comments
Negative fluxes are a result of the way that the telescope works. The VLA is an interferometer – an array of many separate dishes all working together to act as one big dish. It ends up working a bit like a high pass filter. It works great for picking out sharp details and “edges”, but it misses out completely on large, extended sources of flux. So there’s a background flux that isn’t being detected by the telescope – the negative flux is relative to that background level. Single dish telescopes are often used to detect this background flux and “fill in” the negative values.
Its a bit more complicated than that, but look up the “short baseline problem” if you want to learn more.
I’ll confirm the other answer: this is definitely behaviour of the interferometer (in this case, the JVLA). I can’t condense my 4 hour lectures on intro-to-interferometry into one Reddit post, but I can try to give you some intuition for what’s happening here.
The key property here: radio interferometers don’t make images of the sky; they sample the Fourier transform of the sky’s brightness distribution. Afterwards, we can use the inverse Fourier transform to create an image, but it doesn’t come out perfect because we have incomplete information (finite number of measurements that don’t cover the whole Fourier domain).
If you’ve encountered Fourier transforms before, you might recall that they’re basically all about building a function out of a sum of sines/cosines. But recall also that a sine or cosine function has a mean of zero. So if you build an image out of sines, the sum over all pixels is going to be zero. The way normal Fourier transforms fix this is the zero frequency component — a cosine of zero frequency, which is just a constant, which allows the Fourier transform to add a baseline to the whole function to offset the mean/sum from zero.
But interferometers don’t measure the zero frequency component, so we can’t get that in a radio interferometer image. So we accept a compromise. The imaging algorithm is set up so that our point source reconstruction is correct — we can correctly recover intensities for compact sources, but have some issues with larger resolved sources. One of those issues is that the image starts to contain negative intensity “bowls” around sources, particularly complex or resolved sources. This is what’s happening in the image you posted. They have a bunch of radio sources, with positive intensity, and there’s some negative bowl/sidelobe activity in nearby parts of the image. We generally ignore those negative features, or treat them as part of the noise; the mechanics of interferometric imaging tends to result in them not being strong and not significantly impacting the measurements we want to make.