

One of the most mind-bending concepts about the Universe is the idea that the very fabric of space itself is expanding. It was proven, way back in 1922, that this is an inevitable consequence of having a Universe that’s filled, in a near-uniform fashion, with any type (or types) of energy at all. Such a Universe cannot be static and stable, but must, in the context of General Relativity, either expand or contract. When this theoretical framework was combined with observational data measuring the distance to, and redshift of, galaxies external to our own Milky Way, the fact of the expanding Universe was established observationally.
It’s now a full century later, and we’ve learned — to a great degree of accuracy — how quickly the Universe itself is expanding, as well as what forms of energy drive that expansion and how the cosmic expansion has changed over time. Yet, we can only draw these conclusions by examining many different objects at many different cosmic distances, and combining all of that data together. Could we ever hope to see evidence for the Universe’s expansion directly, simply by watching an individual object’s light change over time? That’s the question of our reader Buck, who wants to know:
“One thing I don’t understand is this. If the observable universe is continually decreasing (via expansion), then why can’t we see a change in real time?”
It’s a remarkably simple question, and like many such questions, the answer can provide some profoundly deep insights into the very nature of our expanding Universe. Here’s what changes, and how we can hope to measure those changes directly.
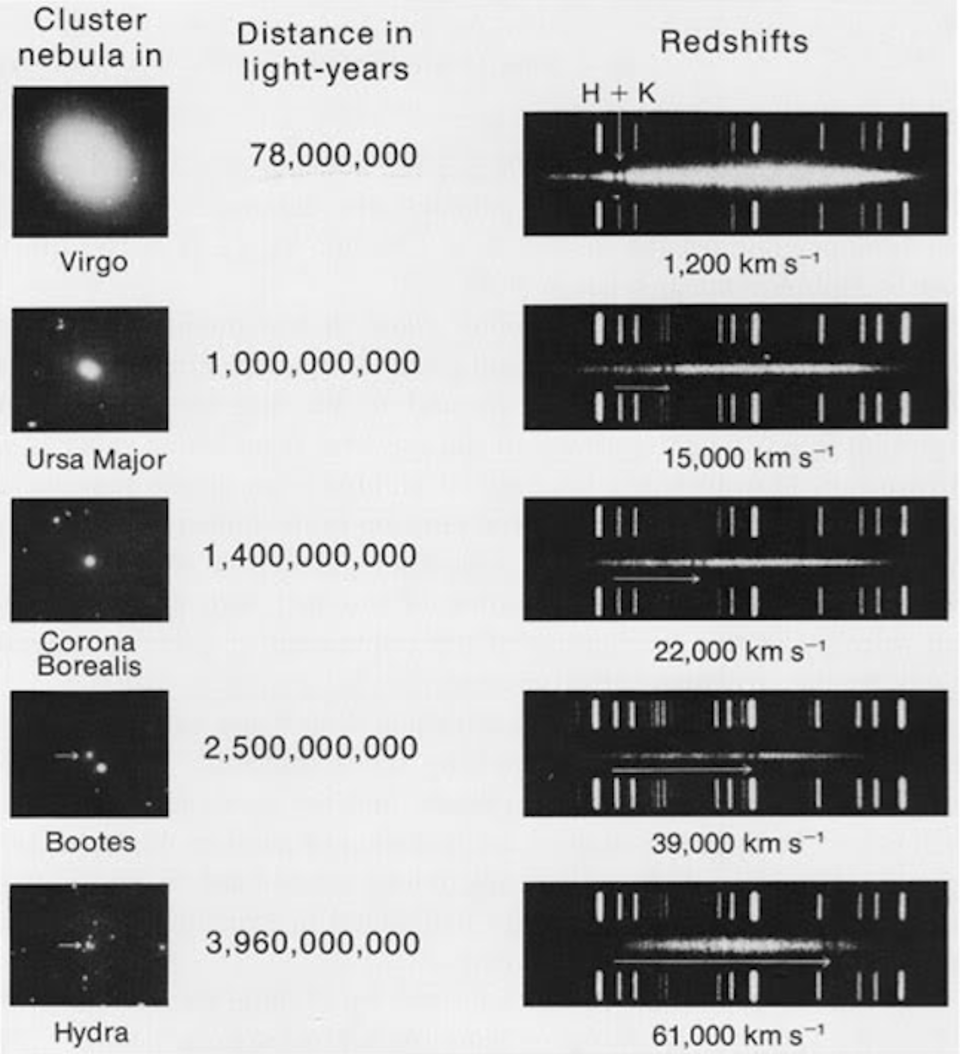
As was first noted by Vesto Slipher back in the 1910s, some of the objects we observe show the spectral signatures of absorption or emission of particular atoms, ions, or molecules, but with a systematic shift toward either the red or blue end of the light spectrum. When combined with distance measurements for those objects, this data gave rise to the initial idea of the expanding Universe: the farther away a galaxy is, the greater its light will appear redshifted to our eyes and instruments.
Credit: Vesto Slipher, 1917, Proc. Amer. Phil. Soc.
The way that we learned that the Universe is expanding came from a very straightforward method. We identified objects that are far away from us, such as galaxies. We used indicators from within those galaxies — variable stars, evolved giant stars with specific colors and magnitudes, overall galactic properties like velocity dispersion, or standardized cataclysms like type Ia supernovae — to determine the distance to those objects. And then, we determined how much the light had been shifted away from its emitted wavelengths to the observed wavelengths that we see, typically using the technique of spectroscopy, where we identify different emission or absorption features that correspond to specific atoms or ions, to measure each object’s redshift.
Even from the earliest days of conducting these measurements, it was clear that there was a straightforward trend: the farther away an object was, the greater the amount that its light was shifted by. This was noticed originally by Georges Lemaître back in 1927, and then was pointed out more prominently by Edwin Hubble in 1929. By the early 1930s, this was understood to imply that the Universe was expanding, and the redshift-distance relation became known as Hubble’s Law. Throughout the rest of the 20th century, this relation was confirmed to greater and greater precisions, with a straight line fitting the data incredibly well. The slope of that line, in particular, told us how quickly the Universe was expanding.
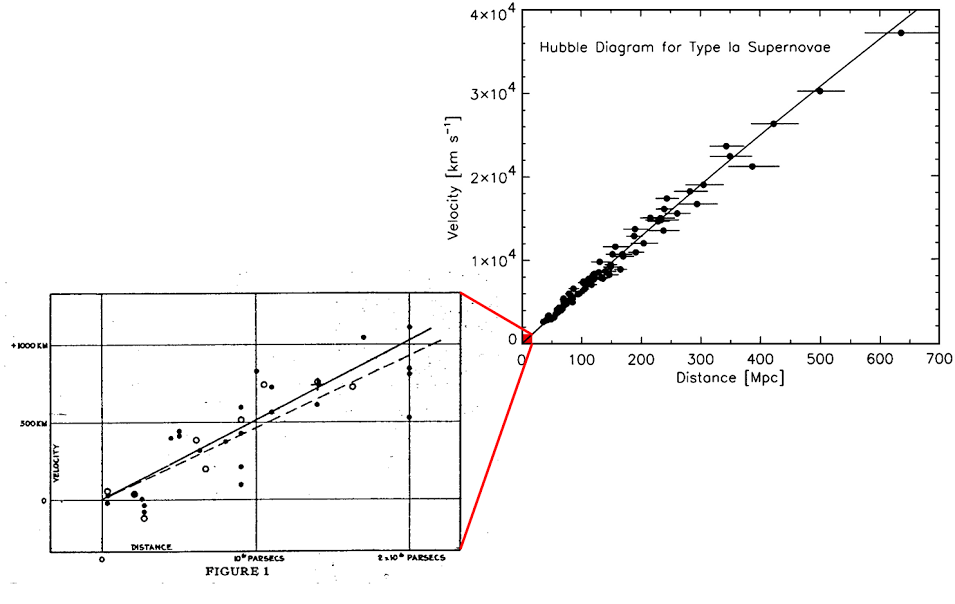
Edwin Hubble’s original plot of galaxy distances, from 1929, versus redshift (left), establishing the expanding Universe, versus a more modern counterpart from approximately 70 years later (right). Many different classes of objects and measurements are used to determine the relationship between distance to an object and its apparent speed of recession that we infer from its light’s relative redshift with respect to us. As you can see, from the very nearby Universe (lower left) to distant locations over a billion light-years away (upper right), this very consistent redshift-distance relation continues to hold. Earlier versions of Hubble’s graph were composed by Georges Lemaître (1927) and Howard Robertson (1928), using Hubble’s preliminary data.
Credit: E. Hubble; R. Kirshner, PNAS, 2004
Then, in the late 1990s, a duet of independent teams working to extend the redshift-distance relation out to billions of light-years — farther than it had ever been extended before — both presented data that was shocking. Instead of maintaining a “straight line” in the slope between redshift and distance, there was a slight uptick at distances corresponding to all forms of light that traveled through the expanding Universe for more than 6 billion years or so. This signaled something unexpected: that the energy contents of the Universe went beyond the expected culprits. In addition to matter (both normal and dark), radiation, and the curvature of space, there was a novel form of energy that was not only present, but that dominated the cosmic energy budget.
This turned out to be the “smoking gun” evidence for dark energy, which was soon bolstered by large-scale structure data and cosmic microwave background data all confirming it. Today, in 2026, even with substantial uncertainties over the nature of dark energy and whether it’s (slightly) evolving or not, and the debate over the Hubble tension and what it means for the expansion rate, we can still be certain of two important things.
Dark energy is real, it dominates the energy density of the Universe today, and it behaves as an accelerating component of the Universe.
And the Universe’s expansion rate is very well known: at about 70 km/s/Mpc, meaning that for every megaparsec (3.26 million light-years) in distance, an object’s light is shifted as though it were receding at an additional 70 km/s from us.
(And no, if you’re wondering, the Hubble tension and evolving dark energy are not the same as each other!)
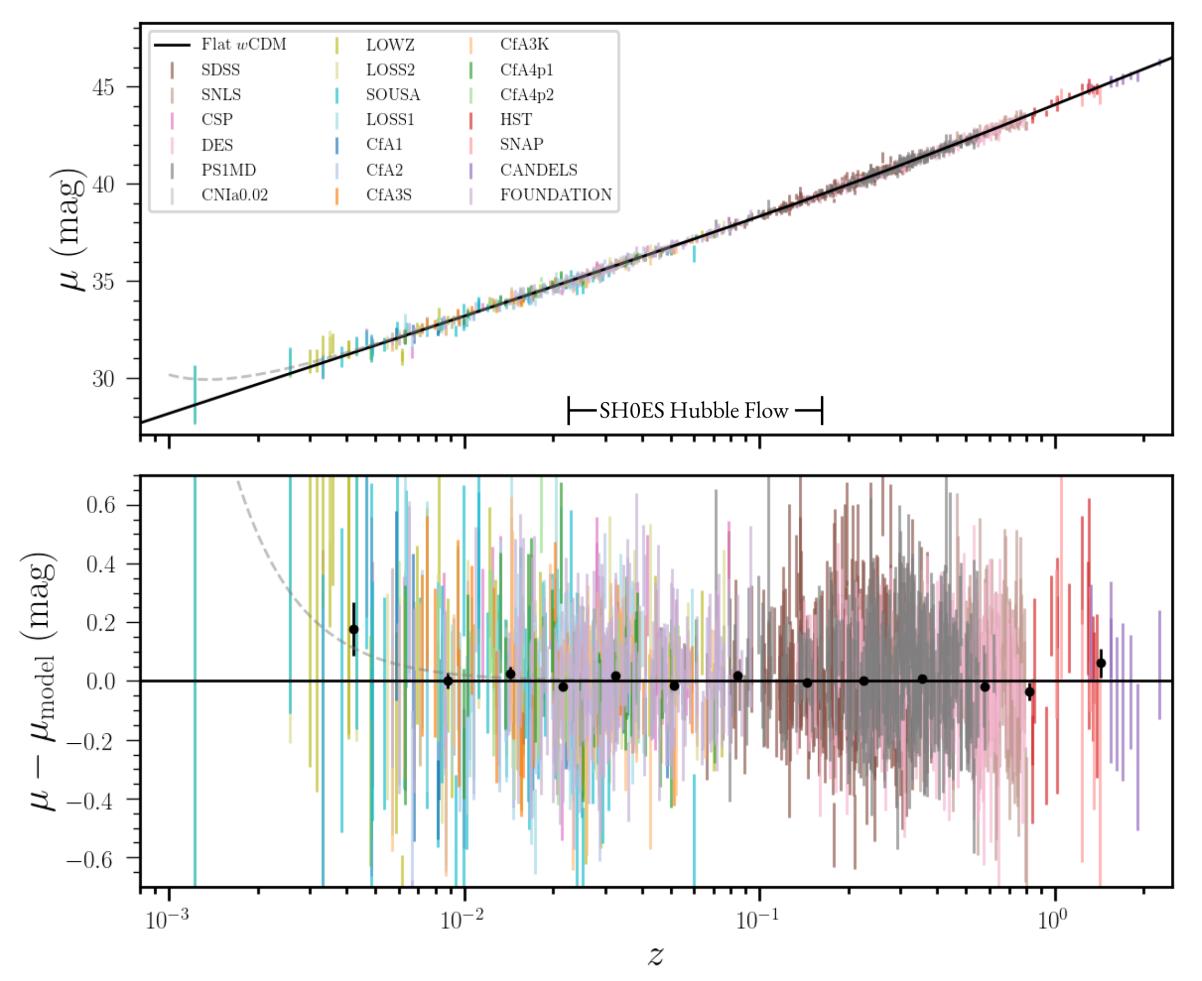
This graph shows the 1550 supernovae that are a part of the Pantheon+ analysis, plotted as a function of magnitude versus redshift. The supernova data, for many decades now (ever since 1998), has pointed toward a Universe that expands in a particular fashion that requires something beyond matter, radiation, and/or spatial curvature: a new form of energy that drives the expansion, known as dark energy. The supernovae all fall along the line that our standard cosmological model predicts, with even the highest-redshift, most far-flung type Ia supernovae adhering to this simple relation. Calibrating the relation without substantial error is of paramount importance.
Credit: D. Brout et al./Pantheon+, Astrophysical Journal, 2022
This is important as background information, because what we’d love to do is not just answer the question of the Universe’s expansion and evolution by observing many different objects all at once. Sure, that’s how we’ve done it historically, because our Universe is very old (13.8 billion years) compared to how long we’ve been measuring it with cutting-edge tools (a few decades, tops), and cosmological changes are very small for any individual object that we can measure. That’s why measuring many different objects, determining their distances and properties, and then using that aggregate data to infer how the Universe is expanding, how the expansion has changed over time, and what the energy contents of the Universe are has been such a powerful method thus far.
Instead, what we’d really like to do is watch one individual object over long enough periods of time that we can actually see the imprints of the expanding Universe as they show up on the individual object in question. This might sound like an impossibility from a practical point of view, as in a 13.8 billion year-old Universe, any changes will only show up at the one part-per-billion level even if we take observations over the course of a full decade. But the effect that we’re seeking to measure is real, and you can understand it not by imagining how a large number of galaxies behave at all different distances in the expanding Universe, but simply by imagining that we’re observing one individual, distant galaxy over long periods of time as the Universe expands.

This simplified animation shows how light redshifts and how distances between unbound objects change over time in the expanding Universe. Note that the objects start off closer than the amount of time it takes light to travel between them, the light redshifts due to the expansion of space, and the two galaxies wind up much farther apart than the light-travel path taken by the photon exchanged between them.
Credit: Rob Knop
It isn’t greatly appreciated about the expanding Universe that there are significant differences between:
the expansion rate today and the expansion rate in the past,
the relationship between the rate of expansion (measured in km/s/Mpc) and the measured redshift (which corresponds to a recession speed when converted to km/s),
and what separates an accelerating Universe from a decelerating one.
The expansion rate, for example, depends on the total amount of matter-and-energy in the Universe. As the Universe expands, it gets less dense: at least, less dense in terms of the matter and radiation within it. The dark energy density — if it’s truly a cosmological constant, which is currently the null hypothesis for dark energy — remains constant as the Universe expands.
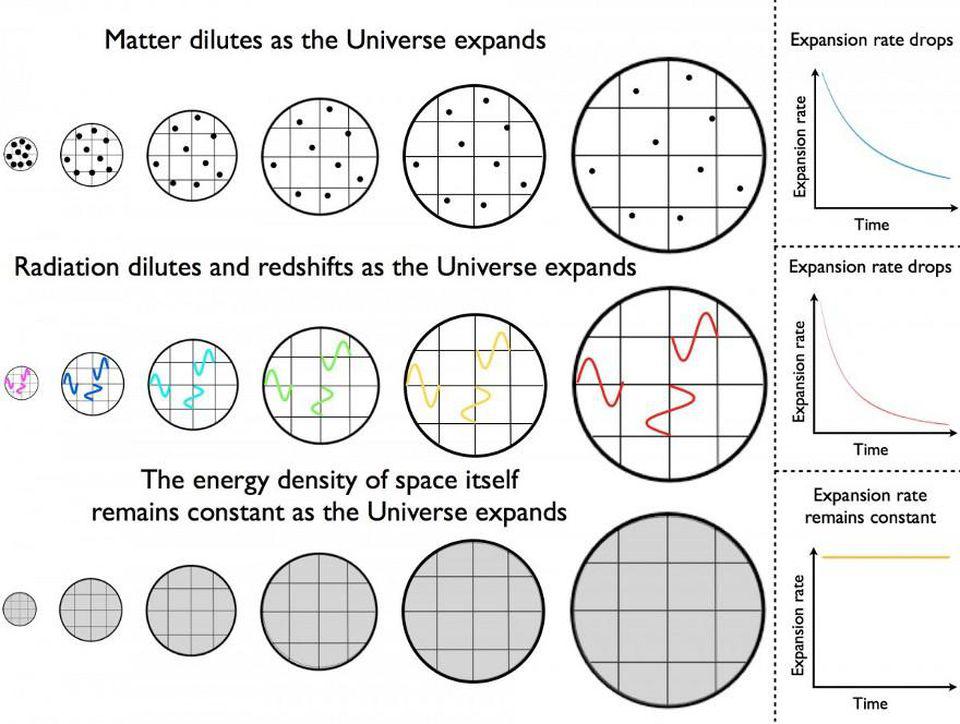
How matter (top), radiation (middle), and dark energy/inflationary energy (bottom) all evolve with time in an expanding Universe. As the Universe expands, the matter density dilutes, but the radiation also becomes cooler as its wavelengths get stretched to longer, less energetic states. Dark energy’s (or inflationary energy’s) density, on the other hand, will truly remain constant if it behaves as is currently thought: as a form of energy intrinsic to space itself. These three components, together, dictate how the Universe expands at all times from the Big Bang until the present day and beyond.
Credit: E. Siegel/Beyond The Galaxy
We measure the expansion rate in units of km/s/Mpc, which is a speed (km/s) per unit distance (Mpc), because we measure the redshifting of the light (the factor by which the wavelength of the observed light is stretched from its initially emitted wavelength) for each object we observe. That redshift, which we are free to interpret as either:
the speed at which the source-and-observer recede from each other,
or the amount that the light gets stretched by the expansion of the Universe,
corresponds to a measured distance for each individual object. When we put all that information together, we get the expansion rate in km/s/Mpc, with each object being a certain distance (in Mpc) away and exhibiting a redshift that corresponds to a particular recession speed (in km/s).
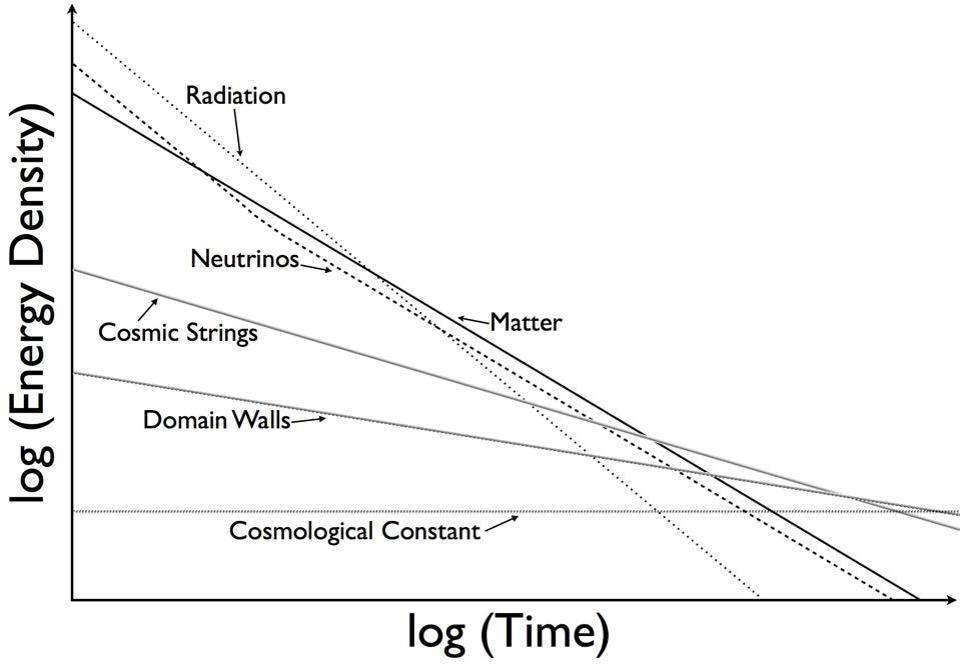
Various components of and contributors to the Universe’s energy density, and when they might dominate. Note that radiation is dominant over matter for roughly the first 9,000 years, then matter dominates, and finally, a cosmological constant emerges. (The others, like cosmic strings and domain walls, do not appear to exist in appreciable amounts.) However, dark energy may not be a cosmological constant, exactly, but may still vary with time by up to ~4% or so. Future observations will constrain this further.
Credit: E. Siegel / Beyond the Galaxy
We can then understand the difference between “an accelerating Universe” and “a decelerating Universe” in terms of what the observations of any one galaxy would show us if we observed it over long enough periods of time. Right now, for instance, if the expansion rate of the Universe is 70 km/s/Mpc, then an object that’s:
10 Mpc away will recede at 700 km/s,
100 Mpc away will recede at 7000 km/s,
1 Gpc (1000 Mpc) away will recede at 70,000 km/s, or
10 Gpc away will recede at 700,000 km/s,
where that last example has a galaxy recede away at speeds that not only exceed, but are more than double the speed of light! (This doesn’t violate relativity and is perfectly allowed; see here for an explainer.)
However, there’s still a lot of matter in the Universe, with normal and dark matter combined making up about ⅓ of the current energy density. As the Universe expands, a distant galaxy will speed away from us, getting more and more distant over time. Because it’s more distant, there’s a larger number of “Mpc” in your equation as time goes on, and so you’d think that would mean that now-more-distant object would recede faster. But since the energy density has dropped, the expansion rate has dropped, too, so there’s a smaller amount of “km/s/Mpc” that your now-more-distant object recedes at for each “Mpc” it is far away from you.
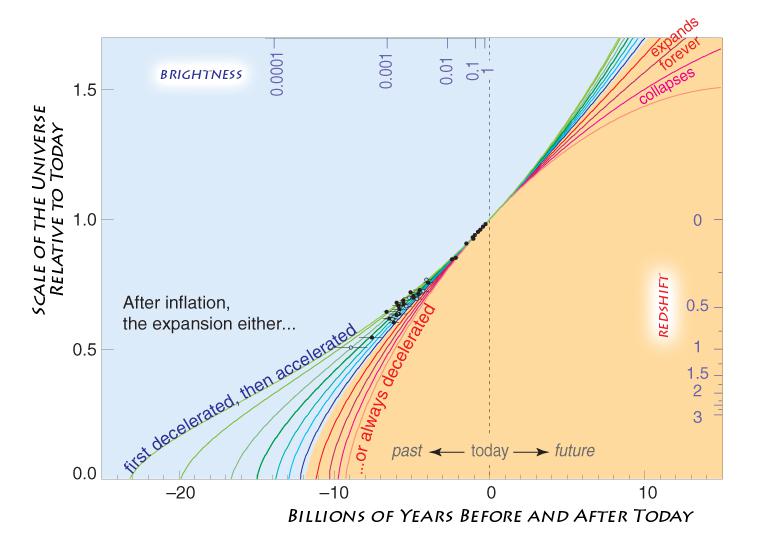
Measuring back in time and distance (to the left of “today”) can inform how the Universe will evolve and accelerate/decelerate far into the future. By linking the expansion rate to the matter-and-energy contents of the Universe and measuring the expansion rate, we can come up with an estimate for the amount of time that’s passed since the start of the hot Big Bang. The supernova data in the late 1990s was the first set of data to indicate that we lived in a dark energy-rich Universe, rather than a matter-and-radiation dominated one; the data points, to the left of “today,” clearly drift from the standard “decelerating” scenario that had held sway through most of the 20th century.
Credit: Saul Perlmutter/UC Berkeley
That’s what the difference between “an accelerating Universe” and “a decelerating Universe” is. An accelerating Universe means that, if you put your finger down on a galaxy and let it move away from you in the expanding Universe, it will appear to move away at faster and faster recession speeds (i.e., it will exhibit an increasing redshift) as time goes on. On the other hand, a decelerating Universe means that, if you put your finger down on a galaxy and let it move away from you in the expanding Universe, it will appear to move away at slower and slower recession speeds (i.e., its redshift will decrease) as time goes on.
The whole difficulty with “directly measuring the expansion of the Universe” means that we’d have to see a galaxy actually display this evolution directly: show a change in its redshift, or its recession speed, over the timescale that we actually observed it for. This concept is known as redshift drift, and even if we applied it to the most distant galaxy of all, MoM-z14, it would be an incredible challenge to directly observe. At a redshift of z = 14.4 and with multiple emission lines to observe, it’s presently about 10.4 Gpc away (10,400 Mpc), meaning that its corresponding recession speed (with a current rate of 70 km/s/Mpc) is 728,000 km/s.
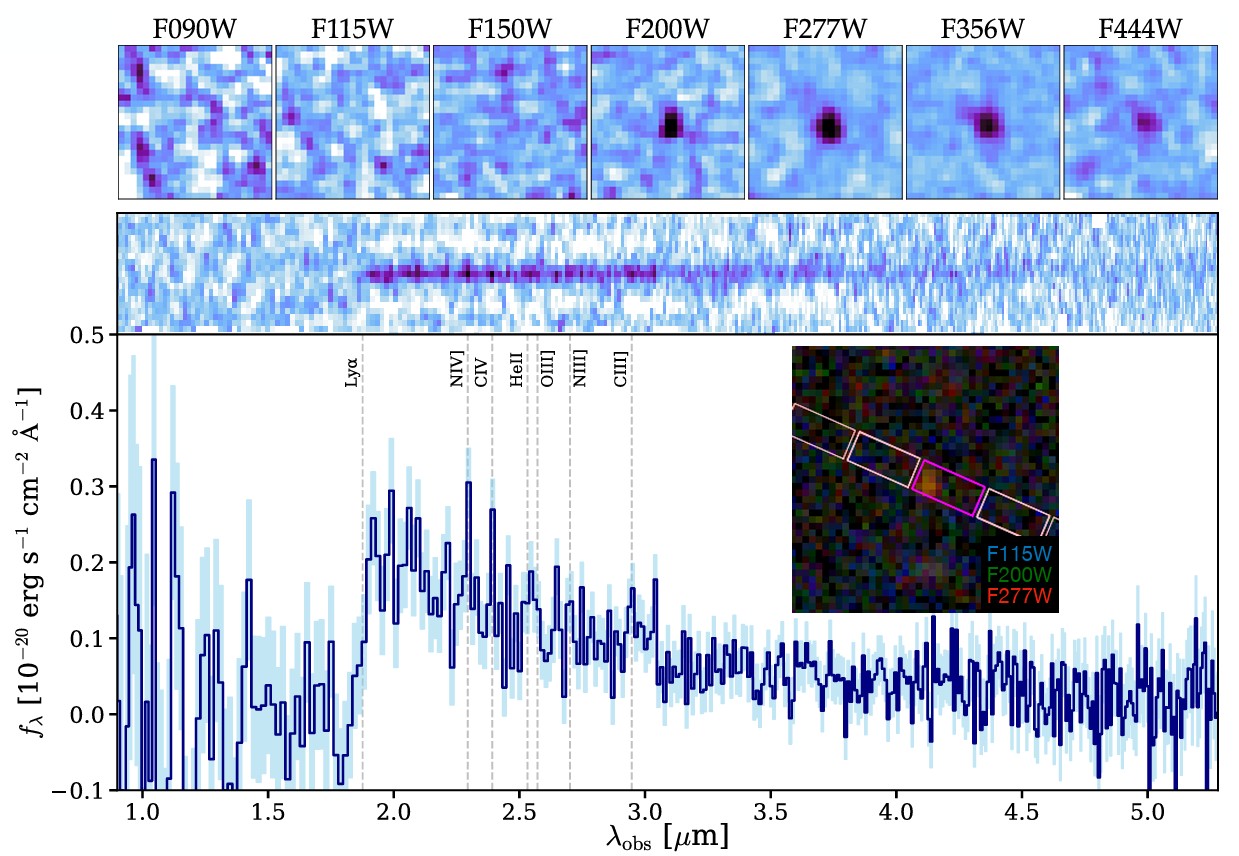
This figure shows the NIRCam (top) and NIRSpec (bottom) data for now-confirmed galaxy MoM-z14: the most distant galaxy known to date as of May 2025. Completely invisible at wavelengths of 1.5 microns and below, its light is stretched by the expansion of the Universe. Emission features of various ionized atoms can be seen in the spectrum, below, as well as the significant and strong Lyman break feature.
Credit: R.P. Naidu et al., Open Journal of Astrophysics (submitted)/arXiv:2505.11263, 2025
Although there’s a lot of math involved in calculating what the redshift drift will be, the simplest picture is to imagine that a small amount of time now elapses from when we take this measurement and when we go back to measuring this object once again.
Over, say, a period of one year, the galaxy will now be a little bit more distant from us than when we began observing it: about 2.4 light-years (or about ¾ of one-millionth of a Mpc) more distant. The expansion rate will have dropped by a tiny bit over this period of time, but it turns out that amount is roughly negligible for the specific puzzle we’re considering.
Therefore, when we look at this object a year later — the most distant one known, and hence, the one with the most severe redshift drift — since it’s now more distant (by even 2.4 light-years), it’s receding from us just slightly more quickly than it was a year earlier. That difference, however, is very tiny, making it very difficult to measure: corresponding to around 5 cm/s of speed for each year for the absolute most distant galaxy of all. This is far beyond the reach of any ground-based or space-based telescope, but it is potentially within the reach of the new class of 30-meter telescopes that are coming online in the next few years.
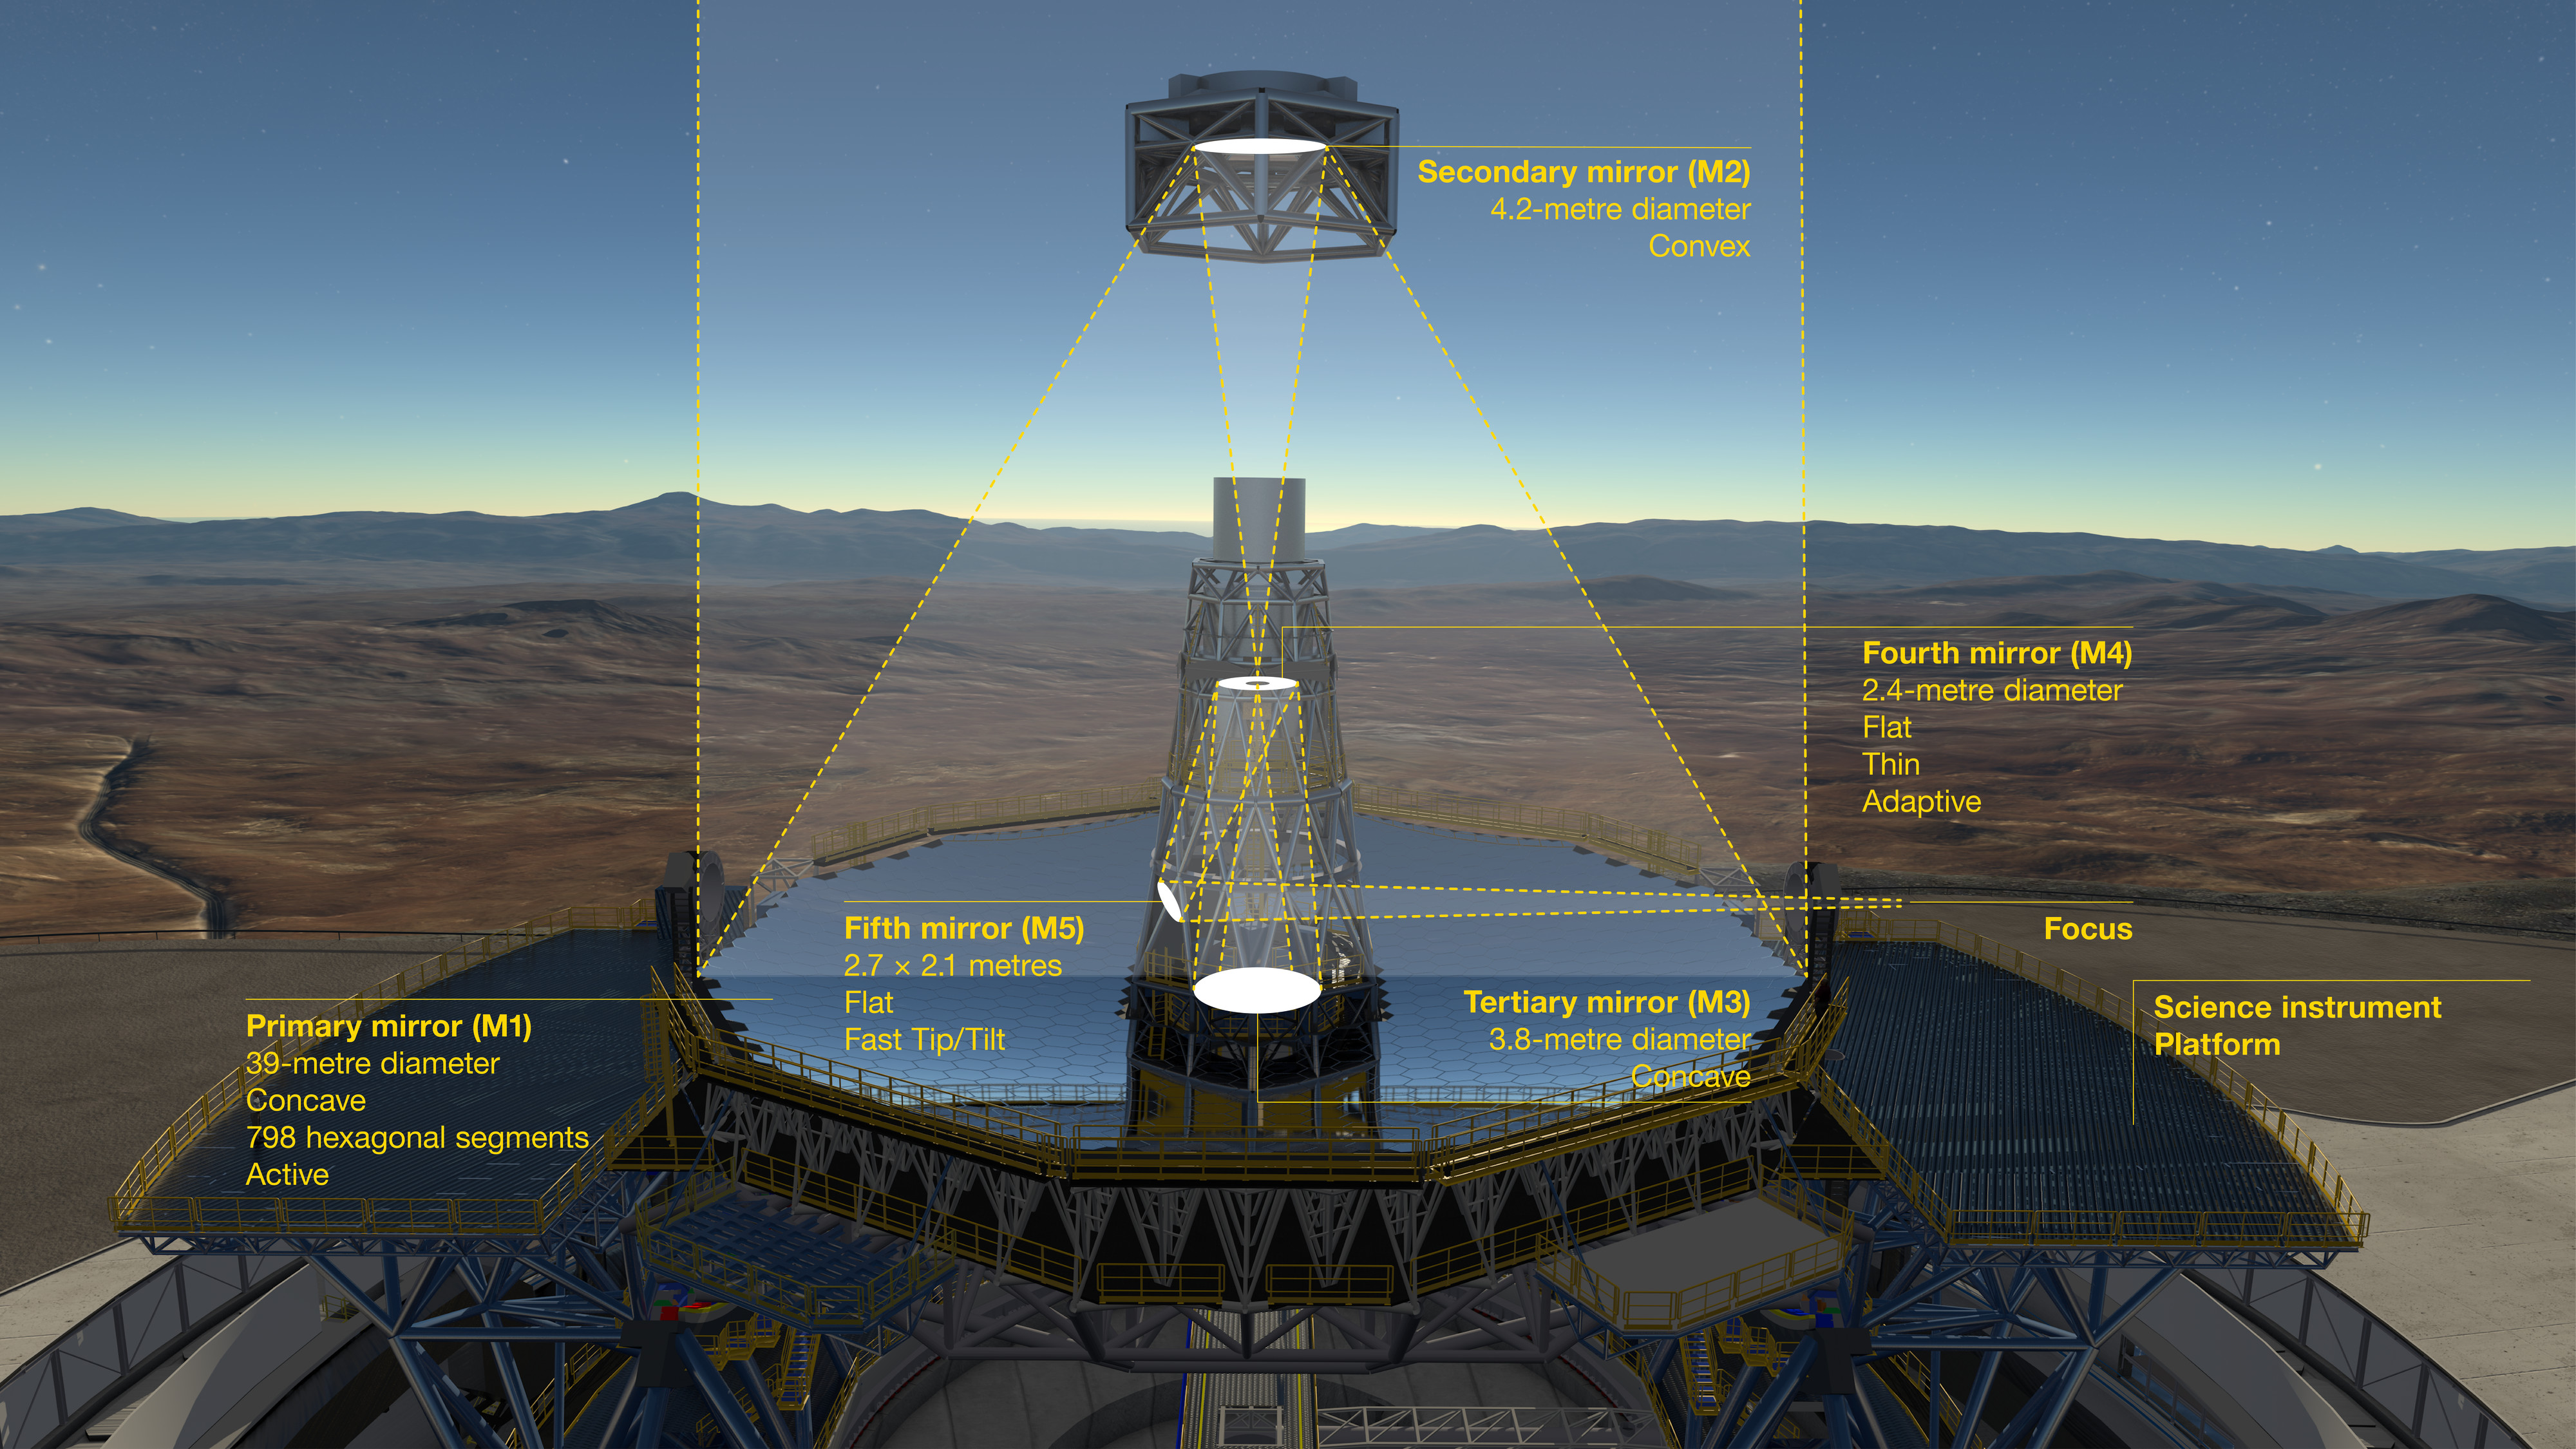
This diagram shows the novel 5-mirror optical system of ESO’s Extremely Large Telescope (ELT). Before reaching the science instruments the light is first reflected from the telescope’s giant concave 39-meter segmented primary mirror (M1), it then bounces off two further 4-meter-class mirrors, one convex (M2) and one concave (M3). The final two mirrors (M4 and M5) form a built-in adaptive optics system to allow extremely sharp images to be formed at the final focal plane. The primary mirror consists of 798 segments to form the 39-meter mirror, but the light that matters isn’t the light that’s collected, but rather the light that reaches the instruments.
Credit: ESO
Whether it’s the 25-meter Giant Magellan Telescope or the 39-meter Extremely Large Telescope that reaches completion first, a gap of about 5-10 years between “first observation” and “last observation” should be sufficient to measure the cosmic expansion directly, and to detect this redshift drift. The JWST, even from its perch in space, is too small to make such precise measurements, and no current ground-based telescope is large enough to gather enough light or achieve high enough resolution (including spectral resolution) to get there. Instead, this is the lowest-hanging fruit for the new, coming generation of ground-based telescopes: an almost-certain discovery just awaiting humanity.
However, there’s an even better way to do this: by using gravitational lensing. When you have a background light source that’s gravitationally lensed by a foreground mass, it can create multiple images of those light sources. Because the distribution of mass is very different along different lines-of-sight, and mass can cause gravitational time dilation in significant amounts (of days, months, years, or even decades), it’s possible to see multiple images of the same galaxy that correspond to different cosmic times, and that should have slightly different redshifts.
In fact, a new JWST survey, seeking to find time-delay supernovae in images of multiply lensed systems, just recently identified a supernova called SN Ares, which has the greatest time delays ever found between multiple images of the same galaxy: around 60 years.
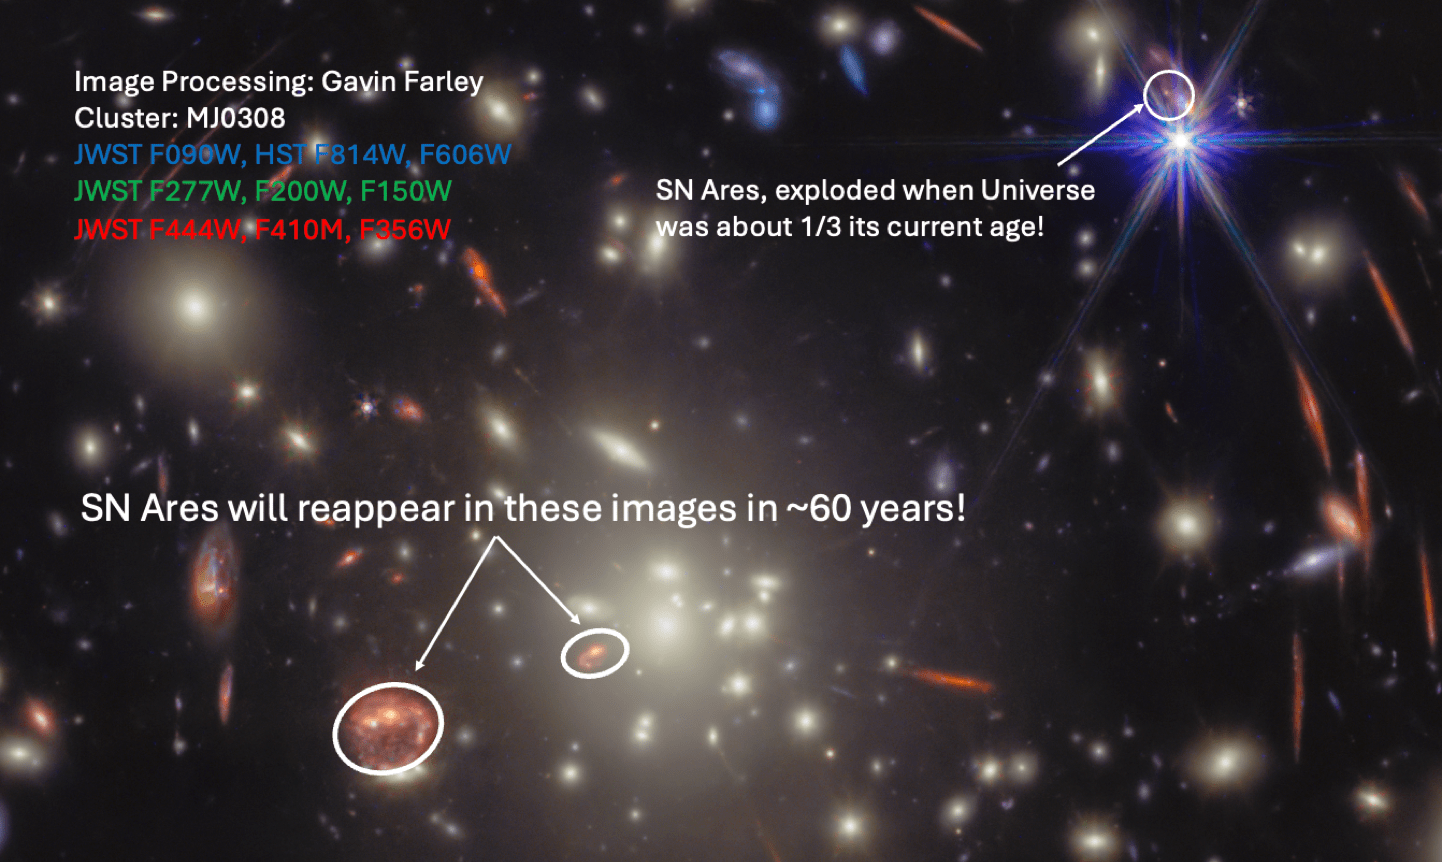
This multicolor image shows a region of interest within the galaxy cluster MJ0308, which was imaged as part of the VENUS collaboration’s work with JWST, and also includes Hubble imagery. Circled in white is the location of the same galaxy appearing multiple times, with one image displaying a supernova and the other image lagging behind, observationally, by about 60 years from our perspective. SN Ares, the supernova, will likely not play a role in helping us understand cosmology until the 2080s.
Credit: NASA/JWST/VENUS collaboration
This would correspond to an expected redshift difference of about 100 cm/s (or 1 m/s) between the two images. Even though this galaxy is only about 40% as distant as an ultra-distant one like MoM-z14, the 60 year time-delay difference means that it’s just as effective to measure those two images of the same galaxy at one moment in time as it would be to observe MoM-z14 with a time difference of 20 years between observations. With just one sufficiently long-exposure observation from a 30-meter class telescope, because of the significant difference in gravitational time dilation between the two images, it’s as though we’re viewing the same galaxy at two different moments in time: 60 years apart from one another.
The observable Universe really does change with time, but not in the way that most people expect. A lot of people think about an accelerating Universe and think that means that galaxies are disappearing from view; that’s not true! Galaxies are disappearing from our reach, in the sense that we can’t travel faster than the speed of light through the Universe to catch up to them, but the light that they emitted long ago is still on the way, and will continue to arrive even far into the future. In fact, more of the Universe will someday be visible, even with dark energy, than we currently see today.
But the Universe’s expansion really is changing the light that we see over time, and redshift drift, originally far beyond the limits of our observatories and instruments, is finally poised to come within reach with the upcoming generation of astronomical tools. With the data we already have, the big questions about dark energy and its evolution, the puzzle of the Hubble tension, and new telescopes just over the horizon, it’s an incredible time to take even greater interest in studying the expanding Universe.
Send in your Ask Ethan questions to startswithabang at gmail dot com!