

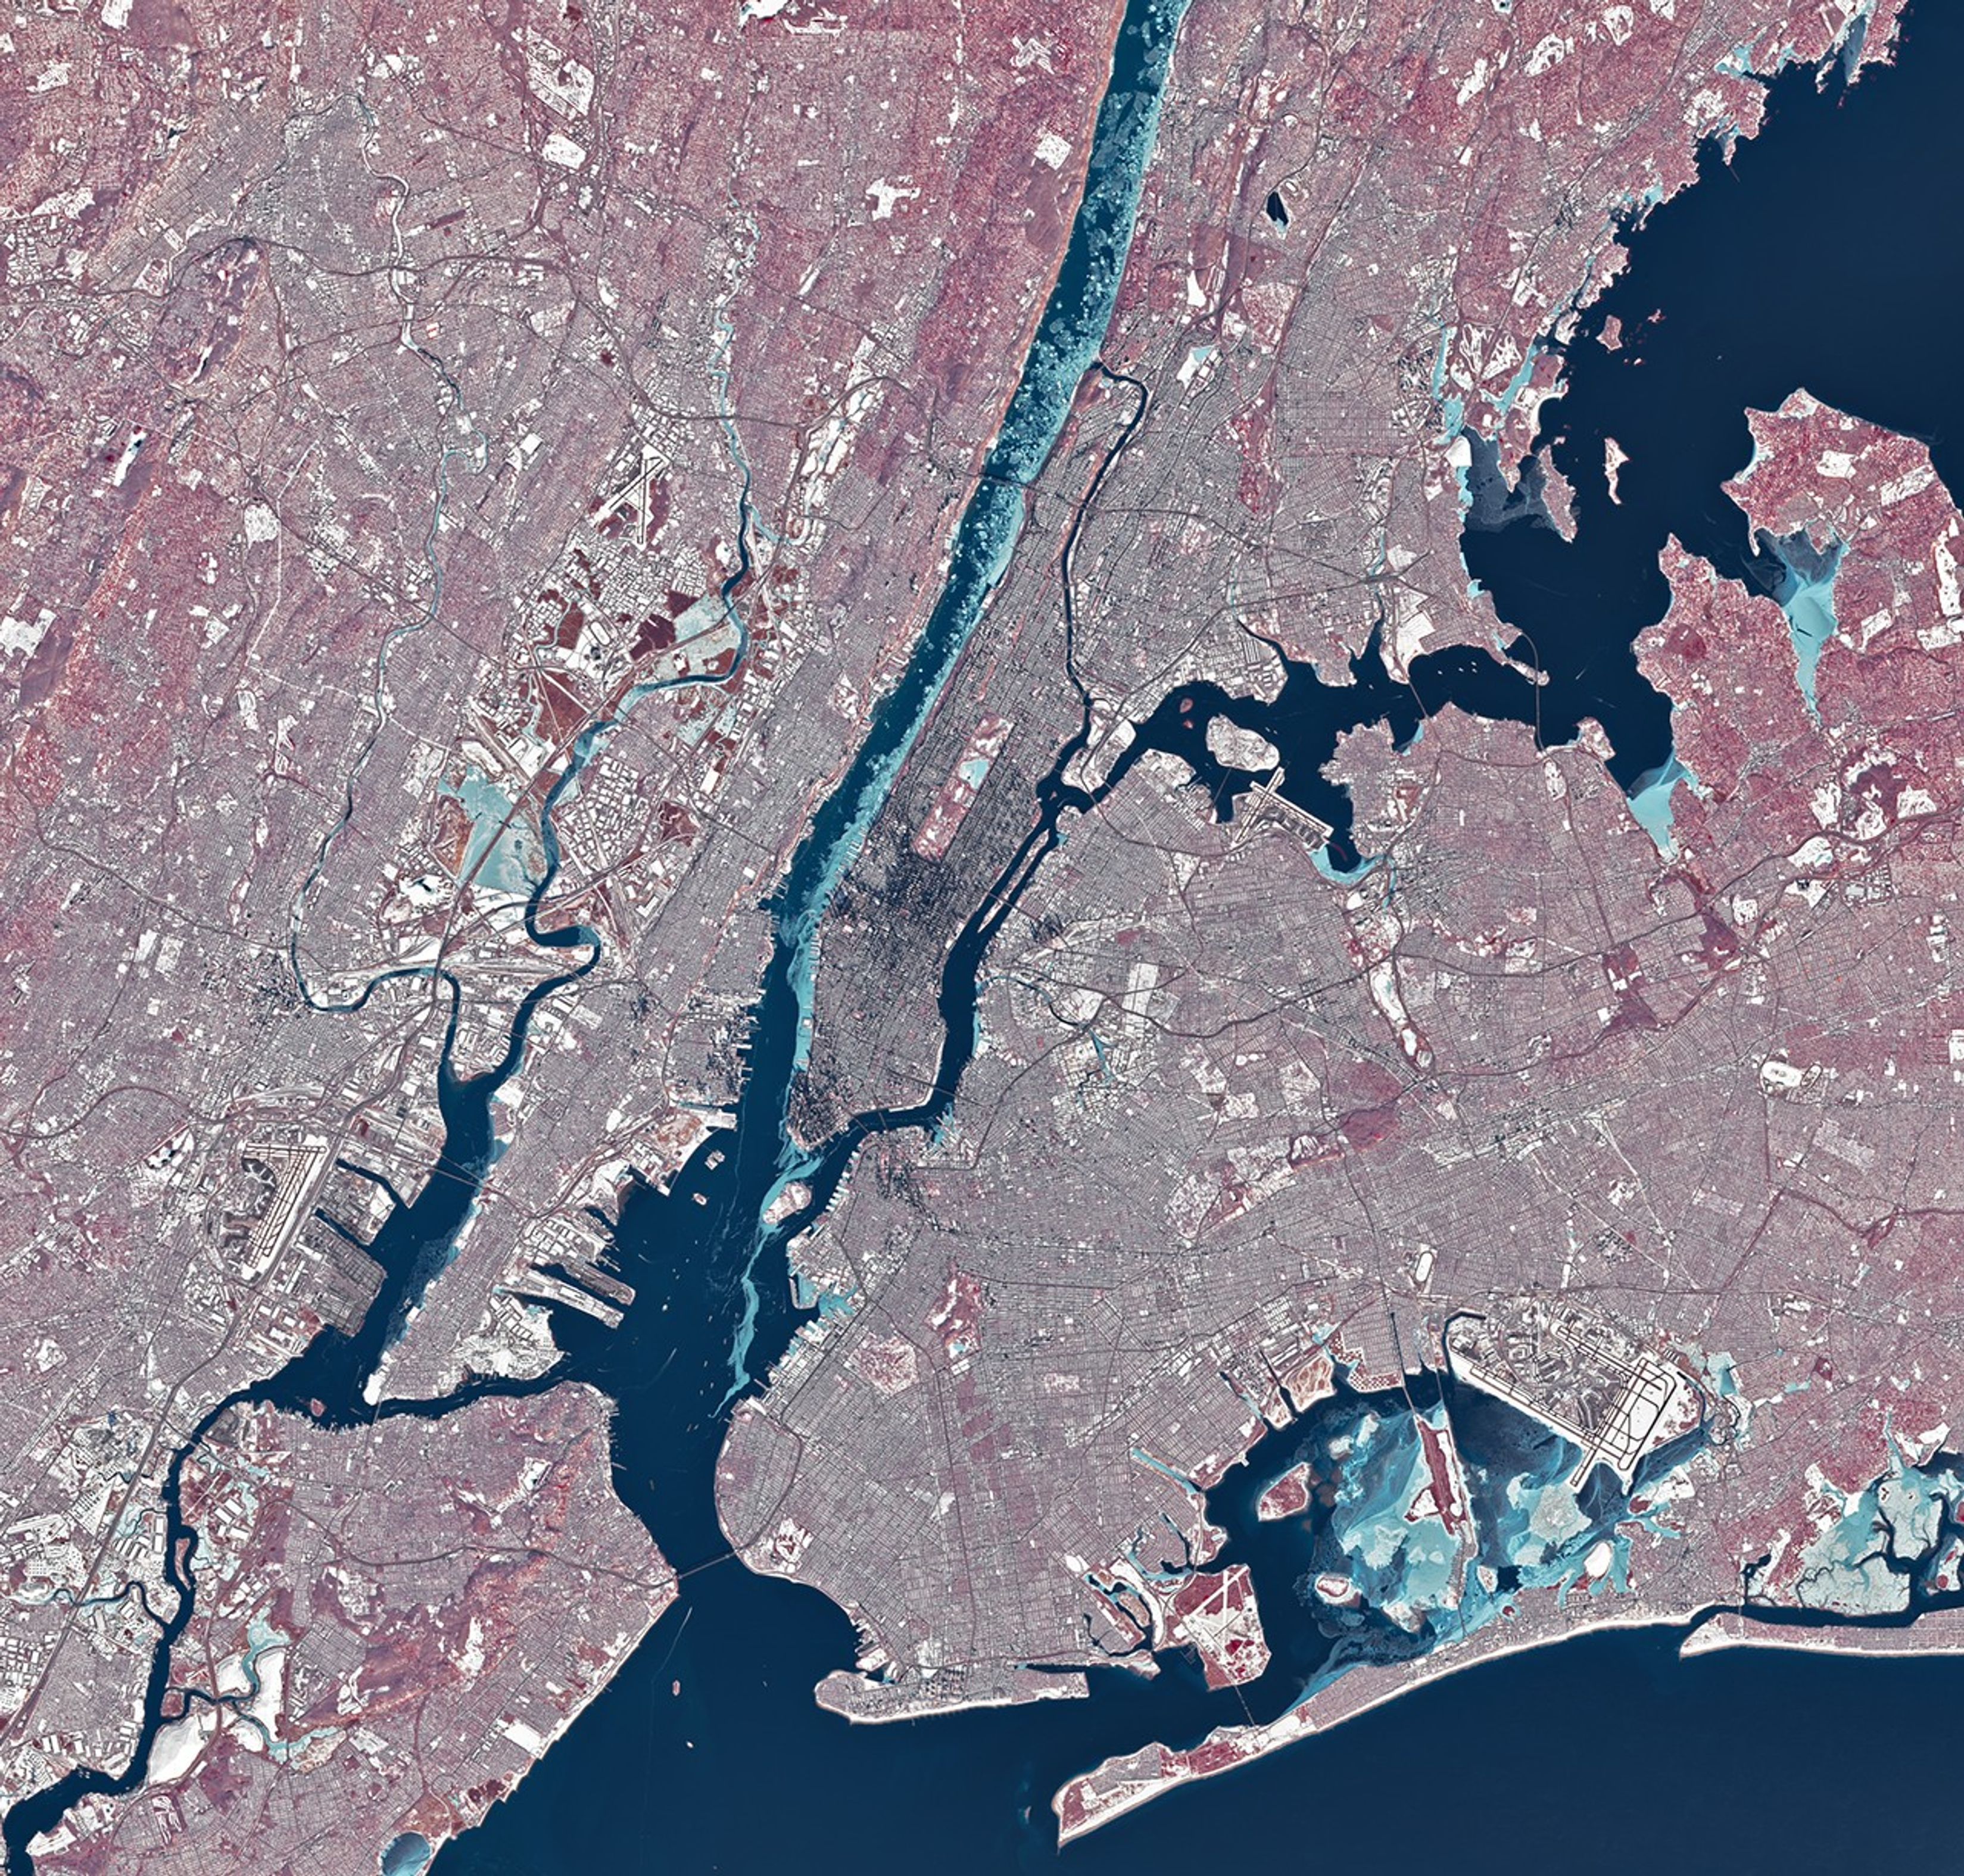
The New York metropolitan area was showing the effects of a prolonged cold spell in late January 2026. During a stretch of frigid weather, ice choked the Hudson River along Manhattan’s western shore.
The OLI (Operational Land Imager) on Landsat 8 captured this image of the wintry landscape around midday on January 28. The image is false-color (bands 5-4-3) to distinguish ice (light blue) from open water and snow. Vegetation appears red. Ice is abundant in the Hudson River and visible in smaller amounts in the East River, the Jacqueline Kennedy Onassis Reservoir in Central Park, and waterways in New Jersey.
Temperatures in New York City dropped below freezing on January 24 and stayed there for over a week. The high on January 28, the date of the image, was 23 degrees Fahrenheit (minus 5 degrees Celsius). Low temperatures and harsh wind chills gripped much of eastern North America over this period amid a surge of Arctic air.
Much of the ice in the image likely floated there from farther upriver, where tidal currents are weaker and salinity is lower. These conditions allow water to freeze sooner and at higher temperatures than the faster-flowing, brackish water near the river’s mouth, shown here. A complete freeze of the Hudson around Manhattan is unlikely, experts say, although it did occur back in 1888. Still, the ice buildup was substantial enough for NYC Ferry to suspend services for several days.
Iced-up rivers can have other implications, from flooding and infrastructure damage to changes in hydrologic processes that affect water quality and aquatic habitats.
Scientists, government agencies, and emergency responders are increasingly turning to remote sensing technologies such as synthetic aperture radar and hyperspectral imaging to track river ice. Improved monitoring can aid in water resource management and mitigate ice’s effects on infrastructure and ecosystems.
In addition to the river ice, other signs of winter were visible across New York. A fresh layer of snow coated the landscape following a winter storm, in which a weather station in Central Park recorded nearly 12 inches (30 centimeters) of accumulation on January 25. And the low angle of the midwinter Sun caused the tall buildings in Midtown and Lower Manhattan to cast long shadows.
In a neighboring borough on February 2, a shorter shadow was cast—this one by the weather-prognosticating groundhog known as Staten Island Chuck. Folklore holds that the sighting signals six more weeks of winter. When compared with data from NOAA’s National Centers for Environmental Information, the New York rodent was deemed the most accurate of his peer weather “forecasters.” This year, Chuck might be right, at least in the near term: the National Weather Service forecast called for below-average temperatures to persist, with Arctic air returning to the city by the weekend.
NASA Earth Observatory image by Michala Garrison, using Landsat data from the U.S. Geological Survey. Story by Lindsey Doermann.
AccuWeather (2026, January 28) Hudson River ice suspends NYC ferry service as deep freeze grips the Northeast. Accessed February 3, 2026.
NASA Earth Observatory (2026, January 30) Extreme January Cold. Accessed February 3, 2026.
National Weather Service (2026) New York, NY, Climate. Accessed February 3, 2026.
The New York Times (2026, January 30) What Would It Take to Actually Freeze the Hudson River? Accessed February 3, 2026.
Zakharov, I., et al. (2024) Review of River Ice Observation and Data Analysis Technologies. Hydrology, 11(8), 126.