

 A powerful magnitude 8.8 earthquake off Russia’s Kamchatka Peninsula sent a tsunami racing across the Pacific—and for the first time, a cutting-edge satellite captured it in stunning detail. Credit: Shutterstock
A powerful tsunami seen from space is overturning what scientists thought they knew about how these waves travel.
A satellite designed to measure ocean surface height delivered a remarkable result when a powerful earthquake near Russia’s Kamchatka Peninsula unleashed a tsunami that spread across the Pacific in late July.
Scientists report in The Seismic Record that the Surface Water Ocean Topography or SWOT satellite recorded the first high-resolution space-based track of a major tsunami generated by a subduction zone earthquake. This new view revealed a far more complicated wave pattern than expected, with energy spreading and scattering across the ocean. The findings could help researchers better understand how tsunamis move and how they may impact coastlines.
Unexpectedly Complex Wave Patterns
Angel Ruiz-Angulo of the University of Iceland and his team combined the satellite observations with readings from DART (Deep-ocean Assessment and Reporting of Tsunamis) buoys positioned along the tsunami’s path. Together, the data provided new insight into the magnitude 8.8 earthquake that struck on July 29 in the Kuril-Kamchatka subduction zone. It ranks as the sixth-largest earthquake recorded worldwide since 1900.
“I think of SWOT data as a new pair of glasses,” said Ruiz-Angulo. “Before, with DARTs we could only see the tsunami at specific points in the vastness of the ocean. There have been other satellites before, but they only see a thin line across a tsunami in the best-case scenario. Now, with SWOT, we can capture a swath up to about 120 kilometers wide, with unprecedented high-resolution data of the sea surface.”
SWOT, launched in December 2022 through a partnership between NASA and the French space agency Centre National d’Etudes Spatiales, was built to map Earth’s surface water on a global scale.
Ruiz-Angulo noted that he and co-author Charly de Marez had spent more than two years studying SWOT data to analyze ocean features such as small eddies. “We had been analyzing SWOT data for over two years understanding different processes in the ocean like small eddies, never imagining that we would be fortunate enough to capture a tsunami.”
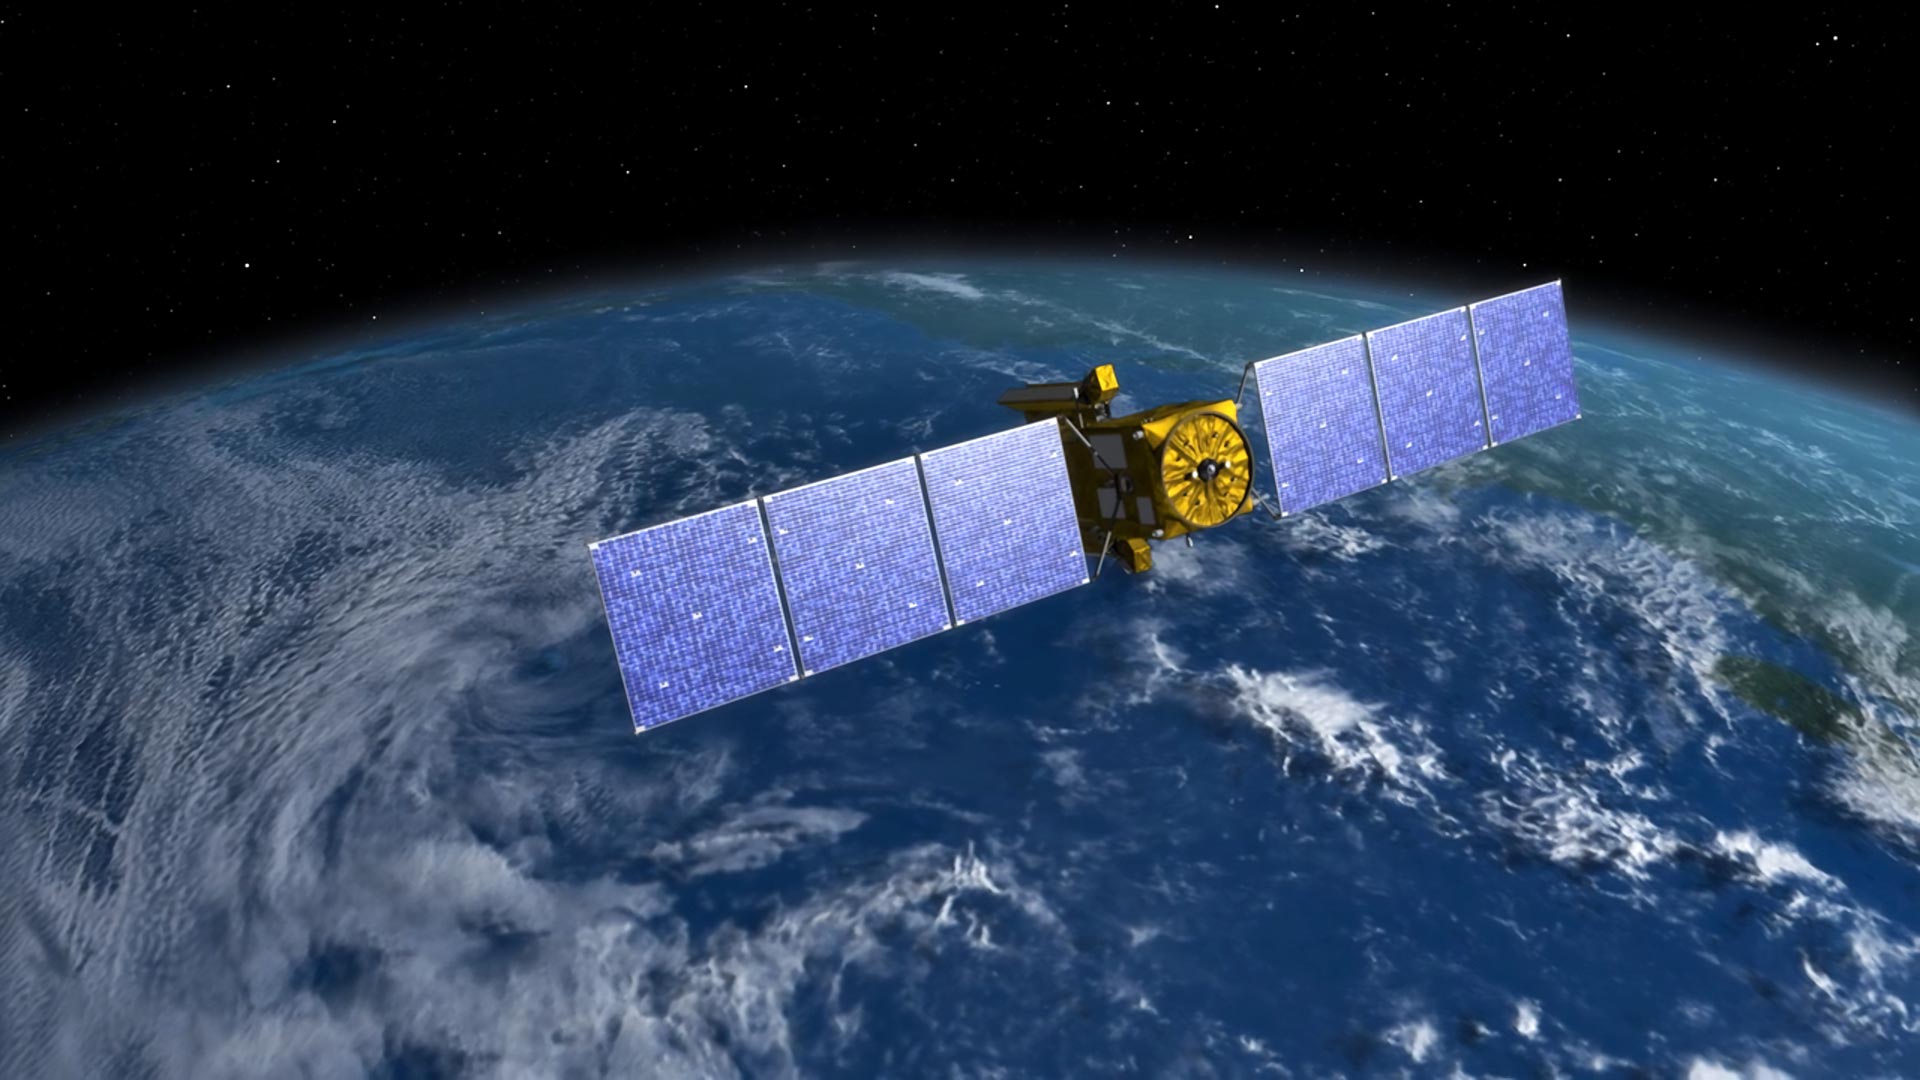 Designed to make the first-ever global survey of Earth’s surface water, the Surface Water and Ocean Topography, or SWOT, satellite collects detailed measurements of how water bodies on Earth change over time. Credit: NASA/JPL-CaltechRethinking How Tsunamis Travel
Scientists have long assumed that very large tsunamis behave as “non-dispersive” waves. Because their wavelengths are longer than the depth of the ocean, they are expected to travel largely intact as a single wave rather than breaking apart into multiple waves.
“The SWOT data for this event has challenged the idea of big tsunamis being non-dispersive,” Ruiz-Angulo explains.
Instead, the satellite observations showed evidence of dispersion, where the wave energy spreads into multiple components. Computer simulations that included this type of behavior matched the real-world data more closely than traditional models.
“The main impact that this observation has for tsunami modelers is that we are missing something in the models we used to run,” Ruiz-Angulo added. “This ‘extra’ variability could represent that the main wave could be modulated by the trailing waves as it approaches some coast. We would need to quantify this excess of dispersive energy and evaluate if it has an impact that was not considered before.”
This animation shows the simulated tsunami wave heights generated by the M8.8 earthquake. Around 70 minutes after the earthquake, the path of the SWOT satellite appears, shown in slow motion to illustrate how the fast-moving satellite captured the tsunami and the dispersive waves that followed the main crest. Credit: Angel Ruiz-Angulo
New Clues About the Earthquake Source
The team also compared their findings with earlier tsunami forecasts that were based on seismic and land deformation measurements. Those earlier predictions did not fully align with what DART instruments actually recorded. In particular, the modeled arrival times at two monitoring sites were off, arriving earlier at one and later at the other than observed.
To resolve the mismatch, the researchers used the buoy data in an approach known as inversion to refine their understanding of the earthquake’s source. Their updated analysis indicates the rupture extended farther south than previously believed and stretched about 400 kilometers. That is significantly longer than the 300 kilometers estimated by earlier models.
“Ever since the 2011 magnitude 9.0 Tohoku-oki earthquake in Japan, we realized that the tsunami data had really valuable information for constraining shallow slip,” said study co-author Diego Melgar.
Melgar explained that researchers have been working to better integrate DART data into these analyses. “But it is still not always done because the hydrodynamic models needed to model DARTs are very different than the seismic wave propagation ones for modeling the solid Earth data. But, as shown here again, it is really important we mix as many types of data as possible,” Melgar said.
Implications for Tsunami Forecasting
The Kuril-Kamchatka region has produced some of the largest tsunamis on record. A magnitude 9.0 earthquake in 1952 triggered a massive Pacific-wide event that ultimately led to the creation of an international warning system. That system played a role in issuing alerts during the 2025 tsunami.
Researchers say the new satellite-based observations could eventually improve real-time forecasting.
“With some luck, maybe one day results like ours can be used to justify why these satellite observations are needed for real or near-real time forecasting,” Ruiz-Angulo said.
Reference: “SWOT Satellite Altimetry Observations and Source Model for the Tsunami from the 2025 M 8.8 Kamchatka Earthquake” by Angel Ruiz‐Angulo, Diego Melgar, Charly de Marez, Aurélien Deniau, Francesco Nencioli and Vala Hjörleifsdóttir, 26 November 2025, The Seismic Record.
DOI: 10.1785/0320250037
Never miss a breakthrough: Join the SciTechDaily newsletter.
Follow us on Google and Google News.