

There’s a legendary bit of wisdom that applies just as well to theoretical physics as it does to the drug culture from which it arose: “Don’t get high on your own supply.” While theoretical physicists are famous for coming up with extraordinary, creative, exotic scenarios for what may yet be possible in the Universe, there’s a great danger in buying into such an idea, and thinking that it’s likely, before a sufficient amount of supporting evidence has come in in favor of it. This was the fallacy that led to the rise of elegant, beautiful, and compelling scenarios — grand unification, supersymmetry, extra dimensions, and string theory — whose predictions simply don’t appear to match experimental reality in any measurable way.
The danger isn’t in having and developing an idea that’s speculative, but rather in believing in it so strongly that you reach for it as your go-to explanation whenever you see even a tiny hint that could potentially support it. This is the cognitive fallacy of motivated reasoning, and even theoretical physicists, particularly when armed with suggestive-but-inconclusive data, are susceptible to it. In the field of cosmology, approximating dark energy with a cosmological constant has been remarkably successful since its presence was first revealed in the late 1990s. However, new data from the DESI collaboration now challenges that assumption, with their analysis claiming to favor a form of dark energy that evolves at a 99.99% confidence level.
Does that mean there’s only a 0.01% chance that dark energy isn’t evolving? Hardly. In fact, the case for evolving dark energy is much weaker than is generally appreciated. Here’s a hard look at what makes the evidence so flimsy.
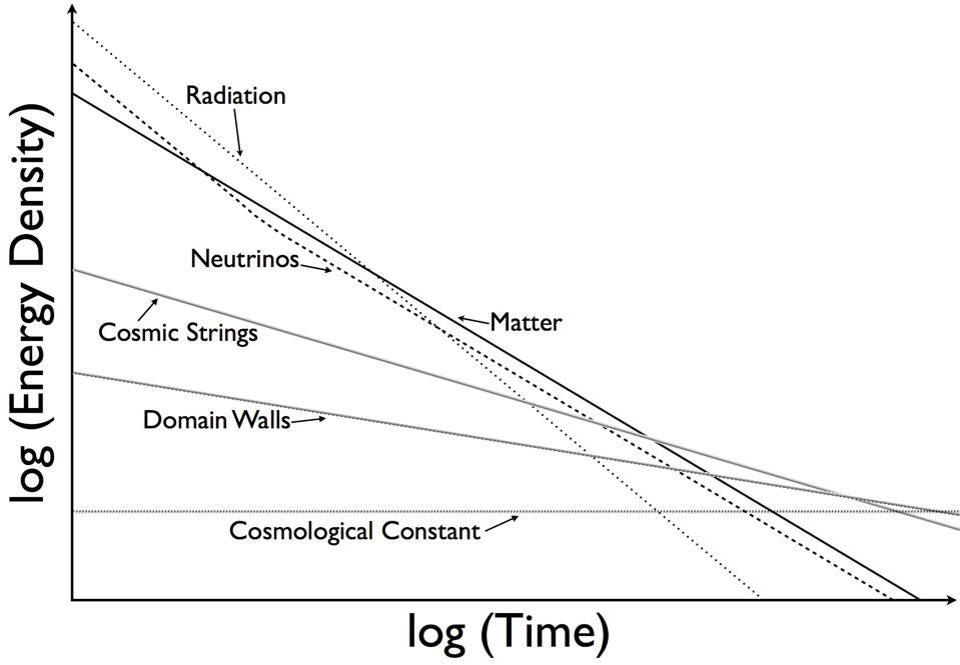
Various components of and contributors to the Universe’s energy density, and when they might dominate. Note that radiation is dominant over matter for roughly the first 9,000 years, then matter dominates, and finally, a cosmological constant emerges. (The others, like cosmic strings and domain walls, do not appear to exist in appreciable amounts.) However, dark energy may not be a cosmological constant, exactly, but may still vary with time by up to ~4% or so. Future observations will constrain this further.
Credit: E. Siegel / Beyond the Galaxy
It’s worth noting that the idea that dark energy could exist, and that it might not be a cosmological constant if it did exist, had been around for decades prior to the supernova data that revealed its presence. People had been considering Universes with:
exotic forms of energy, like cosmic strings, domain walls, and cosmic textures,
scalar fields as forms of energy, where the value (and energy) of the field evolved over time,
or forms of energy that underwent phase transitions, such as through quantum tunneling, where their properties abruptly change,
as early as the 1960s. However, once the existence of dark energy was revealed, the activity of theorists in these arenas simply exploded, with many variants and parametrizations becoming popular or fashionable at various times.
There’s a great power in doing this, but also a great danger. You can always fit whatever data you have more successfully by introducing a greater number of parameters: by adding more complexity to your theory. The principle of Occam’s razor can help us tremendously here: that given multiple explanations for something, the simplest one is usually superior. In physics, that typically boils down to which explanation has the fewest number of free parameters in it. The more parameters you have, the easier it is to not just “fit whatever data you have,” but to overfit the data: appearing to support whatever idea you’ve chosen. This famously reared its head as early as 1953, when Enrico Fermi related something told to him about mathematical fitting by physicist John von Neumann:
“With four parameters I can fit an elephant, and with five I can make him wiggle his trunk.”
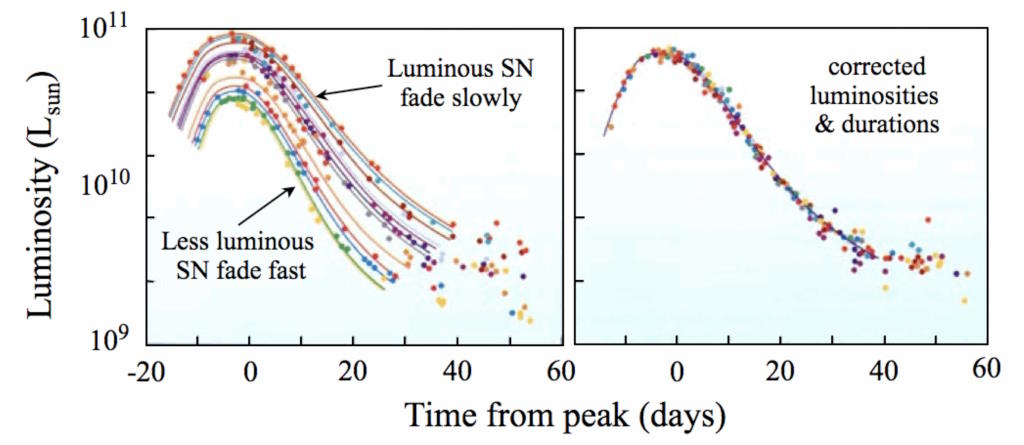
At left, many different type Ia supernovae light curves are plotted, showing substantial differences in the time it takes for these supernovae to brighten and fade, as well as major differences in peak brightness. Once a stretch factor (and color corrections) are applied, at right, a universal supernova light curve can be fitted to all type Ia events. When we do curve-fitting, we always seek to use the fewest number of parameters possible while still keeping the most universally applicable fit.
Credit: Durham University Department of Physics/Astrobites
The lesson is not about elephants, of course, but rather about introducing too many parameters in your model. If you can fit a set of data quite well with a single parameter, there isn’t a motivation to consider a formalism with two (or more) parameters. Of course, with each new parameter that you introduce, you’re almost guaranteed to get a better fit than with fewer parameters; that’s not the point. The point is that it doesn’t matter very much which parameters you choose. Rather, choosing the smallest number of parameters that lead to a successful fit is more important than getting a slightly better fit by allowing additional parameters.
That requires us to be both honest and skeptical about matters such as:
how good (or insufficient) is a fit that uses the smallest number of parameters possible,
if that fit is insufficient, then which new parameters do we introduce (and where do we put them),
and, if we are combining different data sets, are we doing it in a way that gives us insight into those parameters, or are we doing it in a way that unscrupulously motivates the very existence of those parameters?
When it comes to the introduction of something like a new force or a novel phenomenon, the burden of proof on those proposing the new parameters is very high. There must be an extraordinarily high bar for invoking “new physics,” and it’s vital that we don’t fool ourselves.
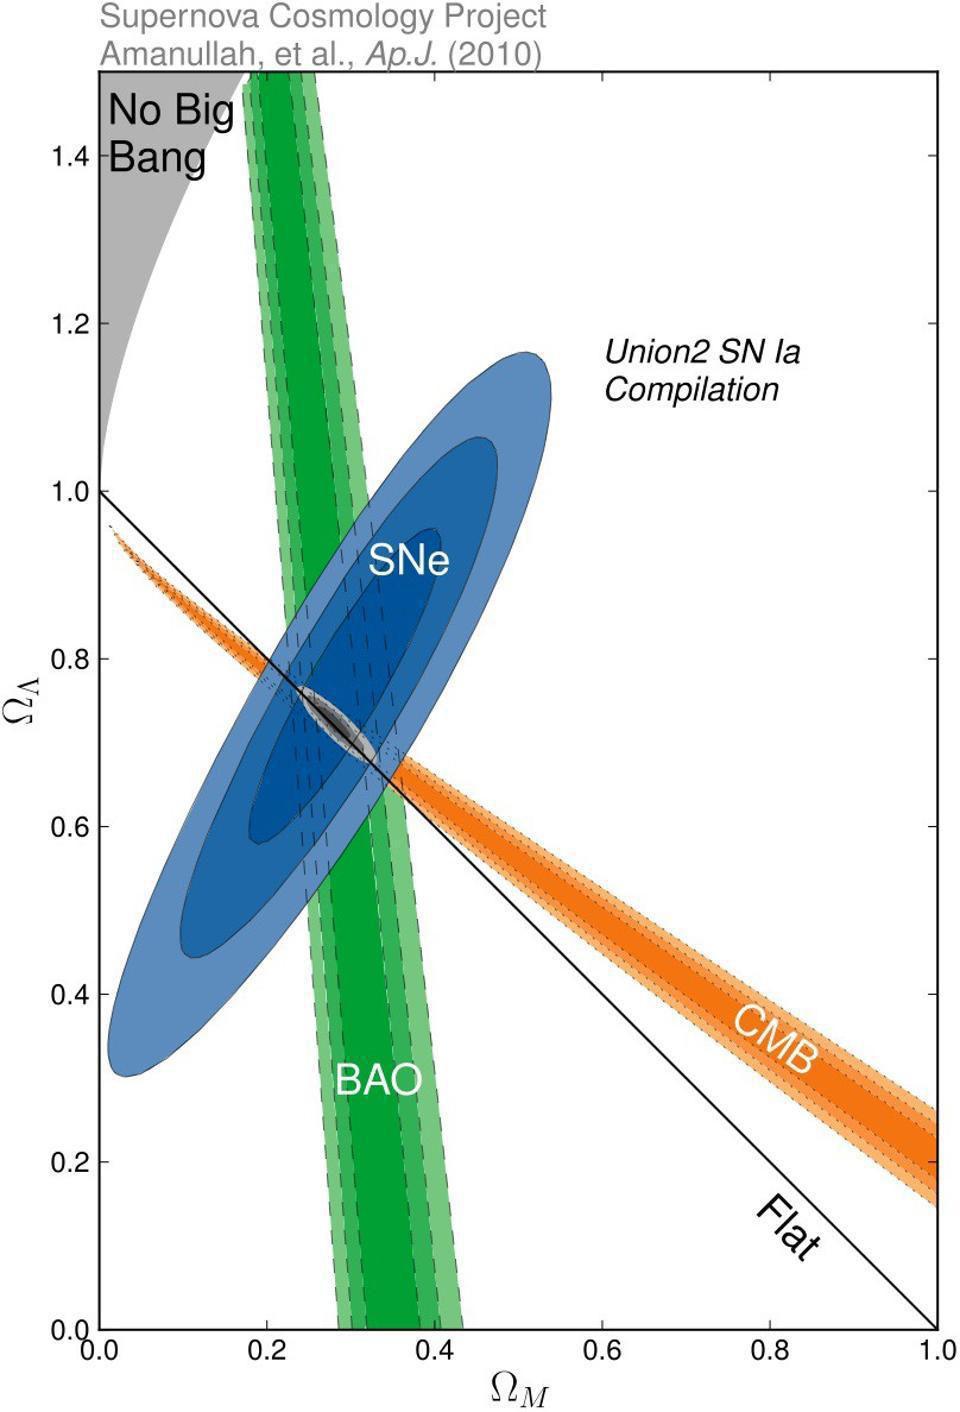
Three different types of measurements, distant stars and galaxies (from supernovae), the large-scale structure of the Universe (from BAO), and the fluctuations in the CMB, tell us the expansion history of the Universe and its composition. Constraints on the total matter content (normal+dark, x-axis) and dark energy density (y-axis) from three independent sources: supernovae, the CMB (cosmic microwave background), and BAO (which is a wiggly feature seen in the correlations of large-scale structure).
Credit: Supernova Cosmology Project, Amanullah et al., ApJ, 2010
The story starts with the graph you see above: where three different data sets, using independent methods and independent measurement techniques, all converged on a single answer to the all-important cosmic question of, “what are the different forms of energy, and in what amounts, that are present in the Universe?” The three different techniques we have are as follows:
To look at the large-scale structure that forms in the Universe, and to see specifically how the distances between any two random galaxies are correlated on cosmic scales as the Universe evolves. (Sometimes called BAO for measuring the baryon acoustic oscillation signal.)
To look at the leftover glow from the Big Bang, at the spectrum of temperature fluctuations (and also at the polarization) imprinted when neutral atoms first formed and the Universe became transparent to radiation. (Often called CMB because of the relic glow of radiation that persists today, the cosmic microwave background.)
And to look at a distant, standardized class of object (most often type Ia supernovae) in the Universe that can be observed at a variety of distances to extrapolate how the Universe has expanded over the timespan that the light has traveled from those objects to our eyes.
Because all three of those different classes of measurement all converged on the same answer, it’s easy to conclude that we got the story right, and that we now know what the Universe is made of: about 30% matter, including normal and dark matter combined, and about 70% dark energy, where dark energy is assumed to be a cosmological constant.
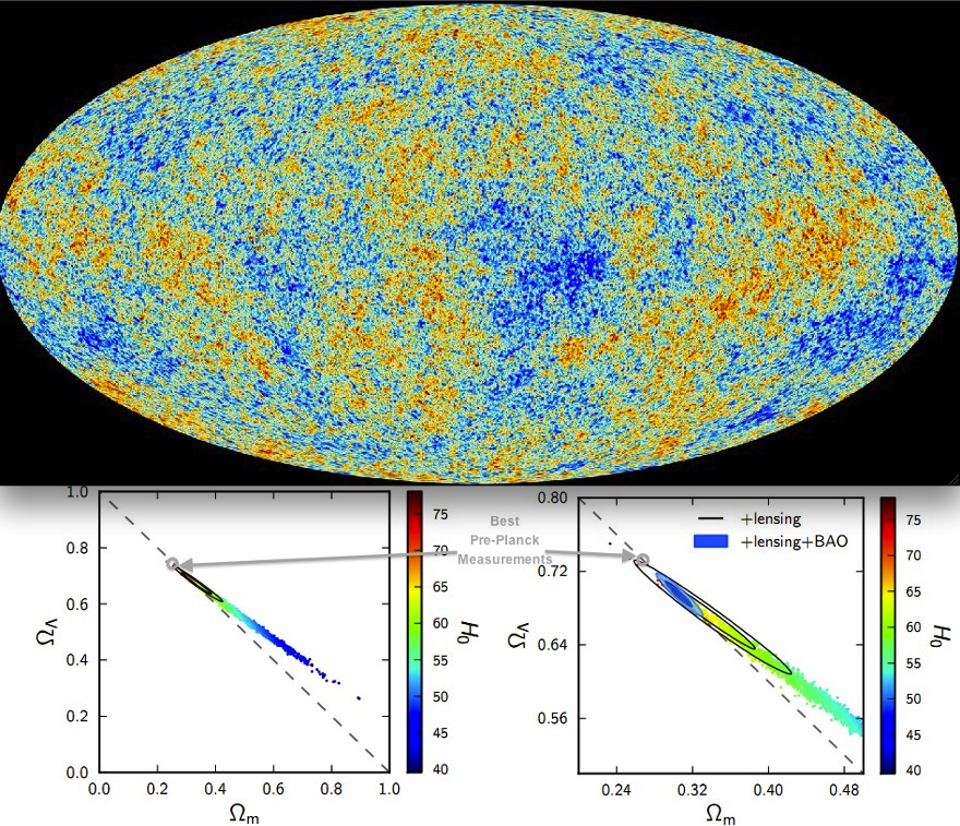
There are many possible ways to fit the data that tells us what the Universe is made of and how quickly it’s expanding, but these combinations all have one thing in common: they all lead to a Universe that’s the same age, as a faster-expanding Universe must have more dark energy and less matter, while a slower-expanding Universe requires less dark energy and greater amounts of matter.
Credit: Planck Collaboration; Annotations: E. Siegel
But more recently, particularly in the past decade, a tension has both emerged and persisted, as hinted at by the color-codes in the image above. When we take the best data that we have from the CMB, including from several different collaborations using independent instruments and data sets, it points to a picture of the Universe that’s still consistent with 70% dark energy and 30% matter, but it demands a specific value of the expansion rate of the Universe today: 67 km/s/Mpc, which has a very small uncertainty of only about 1% on it, preferring a higher value for the matter density and a lower value for the dark energy density.
But if we take the best data that we have from not just measuring type Ia supernovae, but a wide variety of classes of objects that serve as distance indicators that probe extremely large cosmic distances, that data has converged on a different value: 73 km/s/Mpc. This supports a Universe that happens to be about the same age (13.8 billion years) as the CMB-derived value, but happens to prefer a somewhat more dark energy-rich, less matter-rich Universe. While there are plenty of those methods that have large uncertainties on them — in the 5% or more range — the best among those methods has gotten the uncertainty down to the 1-2% level at most.
Around three years ago, this puzzle of the Hubble tension reached the gold standard for significance in particle physics and cosmology: the 5σ level, which means there’s a less than a 1-in-1-million chance of this being a statistical fluke. At the present time, the tension has soared past the 6.6σ level, making this a robust puzzle that many in the community are justifiably taking seriously.
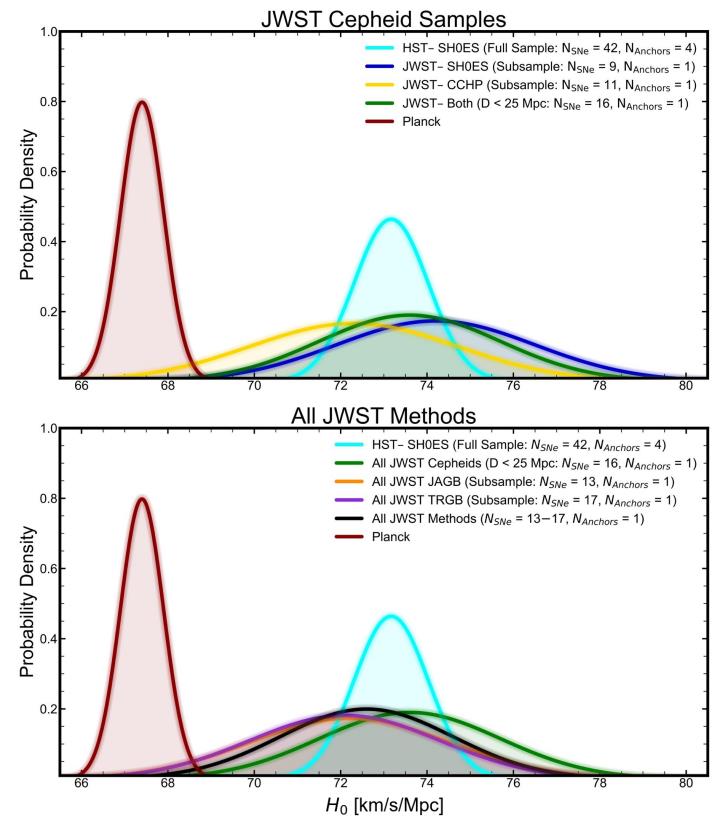
This graph shows a comparison between the value of H0, or the expansion rate today, as derived from Hubble space telescope Cepheids and anchors as well as other subsamples of JWST Cepheids (or other types of stars) and anchors. A comparison to Planck, which uses the early relic method instead of the distance ladder method, is also shown. Very clearly, the distance ladder and early relic methods do not yield mutually compatible results.
Credit: A.G. Riess et al., Astrophysical Journal submitted, arXiv:2408.11770, 2024
Which brings us up to the present day. If that’s what we’re learning from the CMB and the supernova (or other distance indicator) data, what happens when we fold today’s best large-scale structure data into the mix? It’s an eminently reasonable question, and one that you’d ask if you had three independent methods for measuring anything: when you take that third measurement, does it support the first answer, the second answer, or neither?
That’s the question that many large-scale structure surveys are attempting to answer. While we have superior data coming in the next few years from a variety of missions — from Euclid, the Vera Rubin Observatory, SPHEREx, and (launching later this year) the Nancy Grace Roman Space Telescope — the most comprehensive survey we have to date is DESI: the Dark Energy Spectroscopic Instrument, designed to measure the effects of dark energy on the Universe.
Unfortunately, DESI is lousy at measuring the expansion rate on its own; that’s not really where its power is. As a result, it doesn’t have much to say about the problem of the Hubble tension. Instead, its power lies in measuring subtle changes in the expansion rate of the Universe over time, and in the collaboration’s most recent publication (from 2025), they show the results from their work so far.
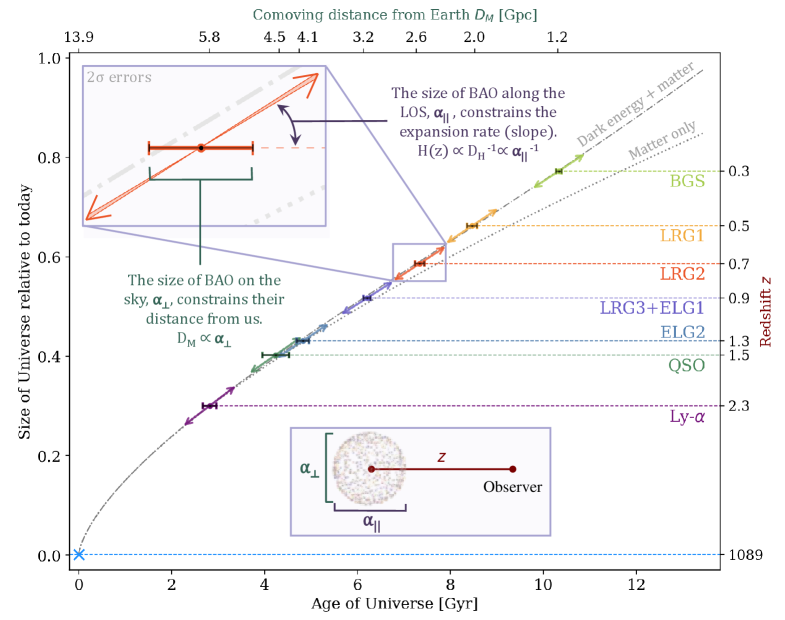
This graph shows the main results from all of the galaxies measured by the DESI collaboration from the DR2 science release. The dotted line represents a matter-only cosmology, while the dot-dash lines represents the best fit cosmology with a mix of matter and dark energy. Note that the binned data points differ slightly from the prediction of the dot-dash line.
Credit: DESI Collaboration/M. Abdul Karim et al., DESI DR2 Results II, 2025
What the diagram above shows is an aggregate of hundreds of thousands of useful data points, representing the size of what we call the acoustic scale an imprint in galaxy clustering that determines how likely you are to find two galaxies located a specific distance apart that expands along with the expansion of the Universe. The fact that you only see eight data points on the graph is because these hundreds of thousands of data points are binned together, providing the constraints you see here. Very clearly, the data is good enough to rule out the possibility that we live in a matter-only Universe (dotted line), and that it strongly supports a Universe made of a mix of dark energy and matter (dash-dot line).
However, if you zoom in very closely, as the inset panel with the red data point does, you can see that there’s actually a slight departure of the red data point (and indeed, other data points) from that best-fit line, which represents the predicted evolution of a Universe with a given ratio of dark matter and dark energy. In general, this is expected: real data rarely coincides with exactly the expected, predicted value. There are all types of errors, both statistical and systematic, and there’s also the fact that we aren’t even sampling the full Universe: just the portion of it revealed by the survey with its limitations.
The key, then, is to see how significantly this data departs from the standard prediction.
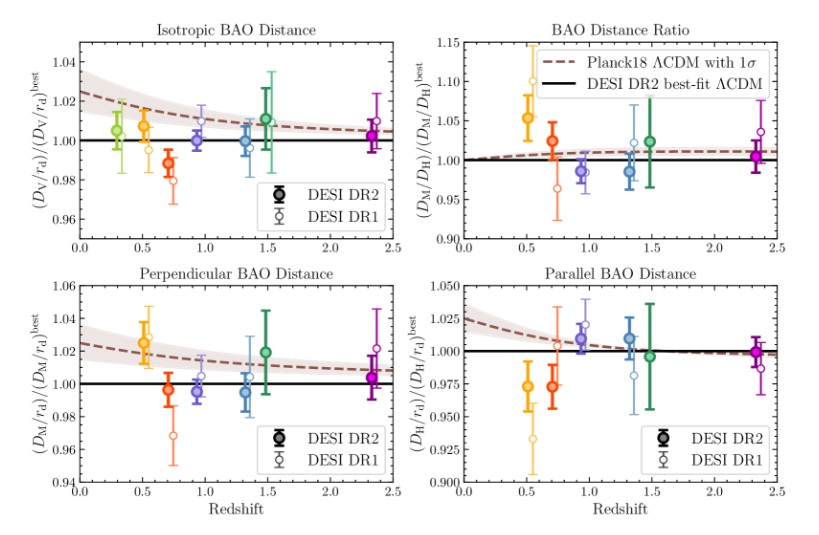
Even a visual inspection, without robust statistical analysis, shows that the points from the DESI data set don’t depart by very much from the best-fit line to the data (solid black line) itself. Statistically, this is only marginally significant, and hence it’s rather suspicious that the DESI team has announced this finding as a hint that dark energy may be evolving. Other, much more sober, conclusions remain in play.
Credit: DESI Collaboration/M. Abdul Karim et al., DESI DR2 Results II, 2025
This is what the graph above shows, and what it shows for two different underlying cosmological models. Only, this time, there isn’t a “matter only” model and a model with “dark energy plus matter,” but rather the following two models.
With a solid line, there’s the “dark energy plus matter” model that’s inferred from making the best-fit line you can make to the DESI data alone. As expected, most of the points lie on the line or are consistent with that line. While there are some points that either rise above the line or fall below the line, everything you see is broadly consistent with the best-fit line itself.
With a dashed line, there’s the best fit model to the CMB data: with a slightly different ratio of dark matter and dark energy, but also a slightly different value for the expansion rate. As you can see, for some of the graphs (like the BAO distance ratio or the Perpendicular BAO distance), the fit is still consistent with the data points, but for others among the graphs (like the Parallel BAO distance or the Isotropic BAO distance) the fit looks significantly worse, particularly in regimes where the CMB data departs most significantly from the best-fit line to the DESI data.
If all you did was compare the DESI data points with the best-fit line to the DESI data, and you asked the question, “how significantly does the data depart from the best-fit line,” which is the same as asking whether we are justified in adding additional parameters, the significance hovers right around the 2σ level: not nearly significant enough to justify it.
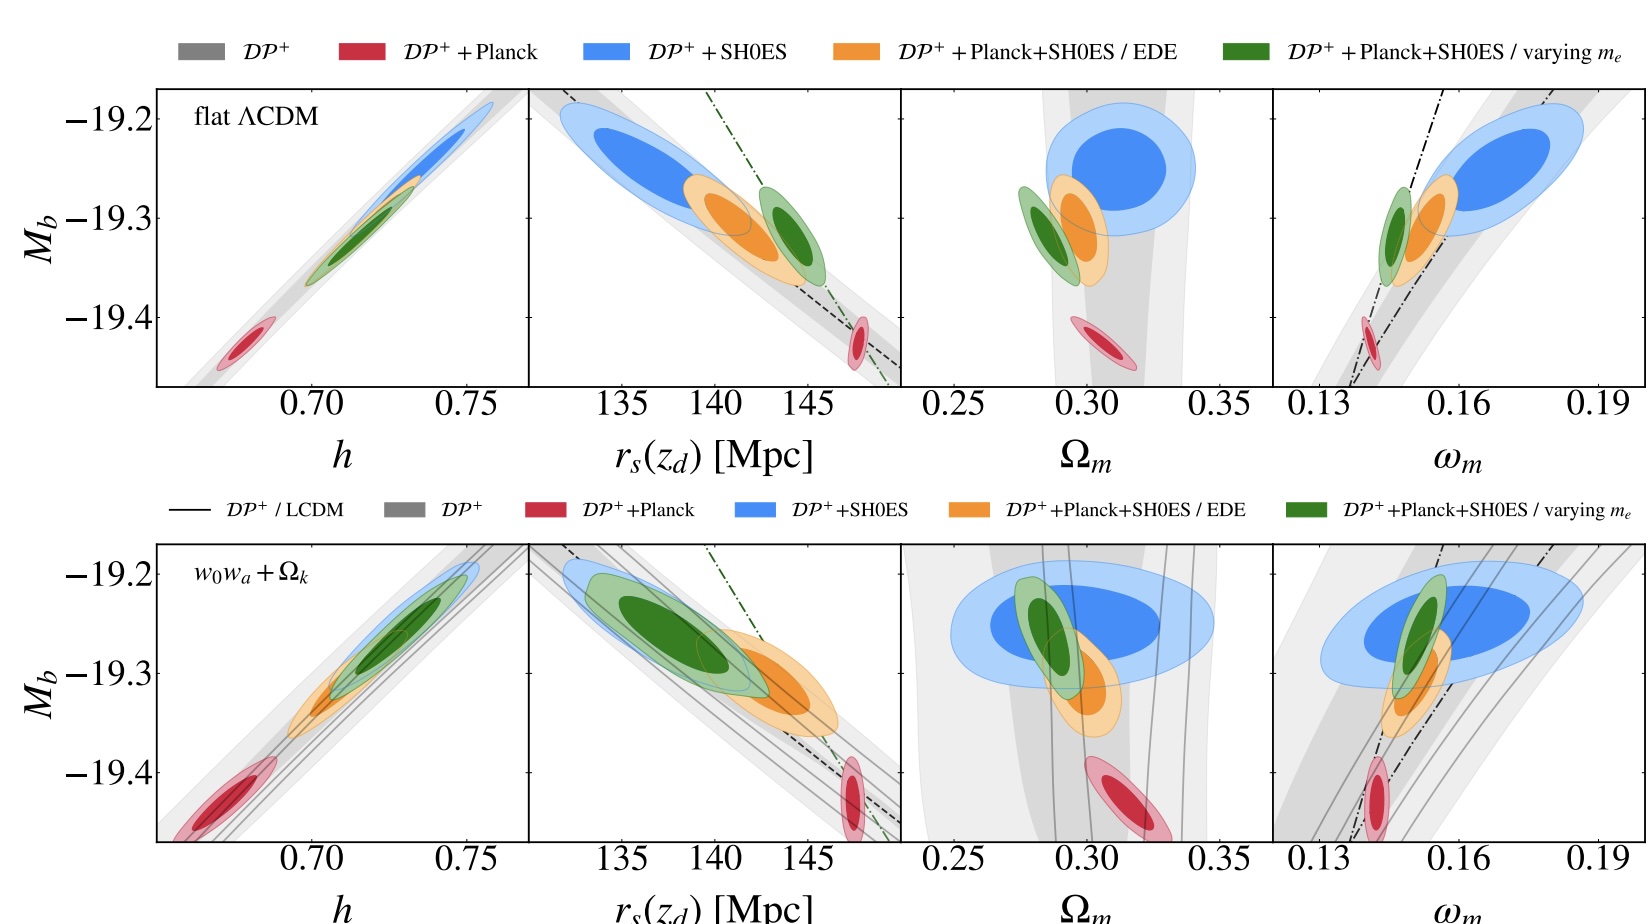
Using DESI (galaxy clustering) and Pantheon+ (type Ia supernova) data yields interesting results for the expansion rate (leftmost panel), the acoustic scale (next panel to the right), and the total matter density (next panel over), but the specific values that they imply depend on how that data is calibrated. A CMB-anchored approach (red) versus a distance ladder-anchored approach (blue) leads to very different values, with evolving models (yellow and green) yielding additional possibilities.
Credit: V. Poulin et al., arXiv:2407.18292, 2024
If the DESI team had stopped there, reported and published those results, and used this as motivation for continuing to look into the issue with superior tools, it would have been business as usual. Incrementally, we’re honing in on measuring the Universe better, and we’re seeing that the existing data that we have isn’t sufficient to reveal what’s actually happening.
But they then went further, and did something that we know we haven’t been able to do for a decade: since the rise of the puzzle of the Hubble tension. What they began doing was combining different data sets, where you add in the CMB data to the DESI data and then fold in additional supernova data, and used that combination to conclude that this points to dark energy’s evolution.
Unfortunately, that’s not how this endeavor works. The different data sets don’t all point to one specific model; each different data set points to a different model. As you can see, above, the different data sets don’t simply give different best-fit values for the expansion rate of the Universe, they also give different best-fit values for the matter density (and, correspondingly, the dark energy density) of the Universe. The act of making this combination is what shouldn’t be happening here; the data sets cannot be reconciled simply by averaging them all together.
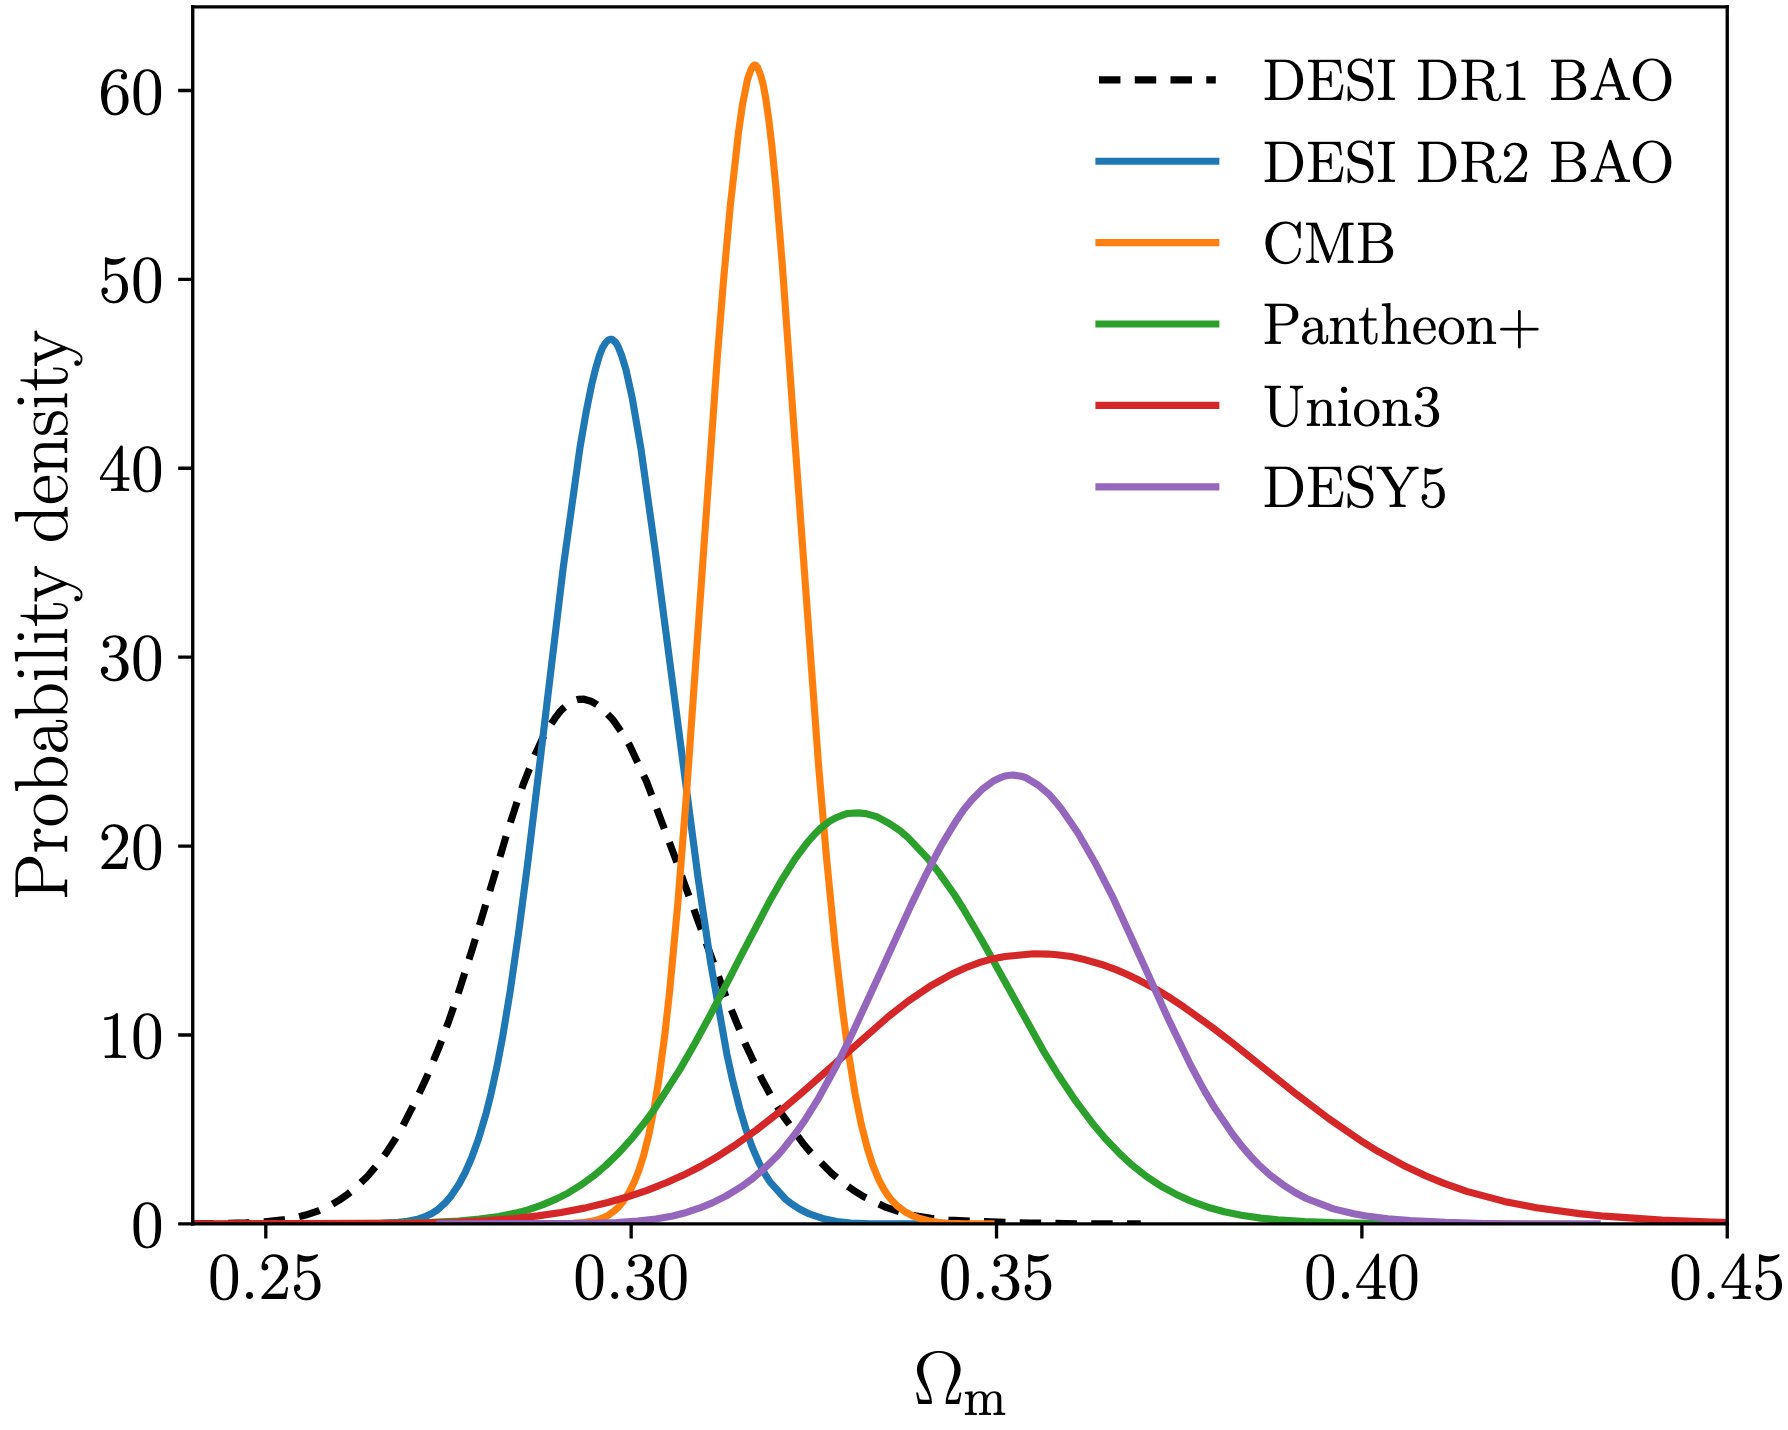
This figure, from the DESI collaboration’s second data release’s results paper, shows the different values of the matter density that are preferred by six different data sets: DESI’s first and second releases, the CMB, and the supernova samples of Pantheon+, Union, and DESY5. Note that BAO and supernova data sets are not really compatible with one another, and that the three different supernova data sets (Pantheon+, Union, and DESY) give wildly different results from one another.
Credit: DESI Collaboration/M. Abdul-Karim et al., DESI DR2 Results, 2025
Of course, you can always add more parameters to get a better fit. But are you justified in doing so? If you’re combining data that should never be combined, or you’re using one example of “a calibrated Universe” to draw conclusions about another data set that’s inconsistent with the calibration from the other data set, then of course things aren’t going to add up. After all, if you force the supernova data to reside in the Universe determined by the CMB’s expansion rate, it’s not going to give you consistent results. If you force the CMB to reside in a Universe governed by the supernova-inferred expansion rate, you’re not going to get results consistent with the data.
Quite unfortunately, that’s where all of the evidence for “evolving dark energy” comes from: by combining these data sets in ways that, quite frankly, it’s irresponsible to combine them. The DESI data, on its own, does an extremely poor job of constraining the expansion rate itself; that’s not what it’s sensitive to. It’s also telling that:
If you combine it only with CMB data, you get results that are consistent, but then become inconsistent if you then add supernova data.
If you combine it with only supernova data, you get results that are consistent, but then become inconsistent if you then add CMB data in.
If you combine it only with Big Bang Nucleosynthesis data, you get meaningful constraints on what the expansion rate is, which are marginally consistent with the CMB’s results, but not with the supernova data.
But when several pieces of data all appear to be in tension with one another, what does it all mean?
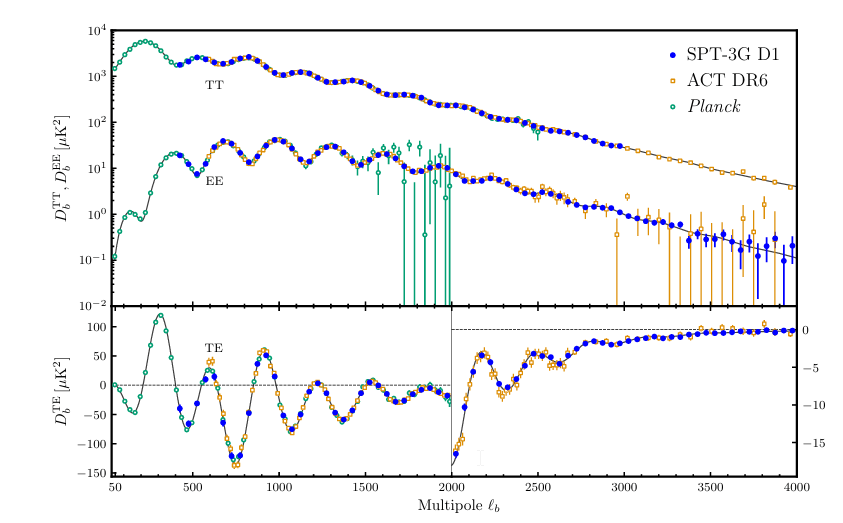
This graph shows the angular scales of CMB fluctuations as measured by Planck, ACT, and SPT down to the smallest angular scales ever probed: about 2 arc-minutes in angular scale. For contrast, the little red dot galaxies seen are all on sub-arc-second scales, more than 100 times smaller in angular size and 10,000 times smaller in angular area than the smallest measured scales of the CMB.
Credit: E. Camphuis et al. (South Pole Telescope collaboration), arXiv:2506.20707, 2025
They range dramatically: from the mundate to the spectacular. The problem is, we’re often tempted to rush to the spectacular, when the perfectly mundane will more than suffice.
There could be a systematic error, where some flaw in the methods used, the calibrations used, or the evolution of the observables themselves is biasing one or more of the results.
There could be an unusual set of properties about one or more of the individual data sets being leveraged: an effect that will disappear once superior, larger data sets arrive. It could be the DESI set, in which case future data from subsequent missions will show that, or it could be one of the supernova data sets, as Union, Pantheon, and DESY data sets behave differently when combined with DESI. (Planck, ACT, and SPT all give equivalent results for the CMB, so that data set is likely exempt from this one.)
Or, quite possibly, this could be something exciting: some evidence for new physics. It could be a new form of energy, a modified or evolving form of existing energy, a phase transition, or something wholly unexpected.
However, that last explanation should really be treated as a last resort: fun to speculate about, but something that’s difficult to consider until the earlier explanations can be fully ruled out. Many scientists are scrupulously working towards that exact end, but superior data sets on many fronts is needed before we’ve arrived.
After all, as Carl Sagan warned us all nearly 50 years ago, “Imagination will often carry us to worlds that never were.” That may well be the case for dark energy and whether it’s truly any different from a cosmological constant, and today’s data certainly isn’t compelling enough to state that dark energy does evolve. However, we must remain open to such a possibility, and must keep checking — as more and superior data keeps coming in — to see which explanation best matches the data. Although stronger evidence is required to discern a cosmological constant from evolving dark energy, the sometimes-omitted second half to Carl Sagan’s quote reminds us of the importance of keeping an open mind: “Imagination will often carry us to worlds that never were, but without it, we go nowhere.”