

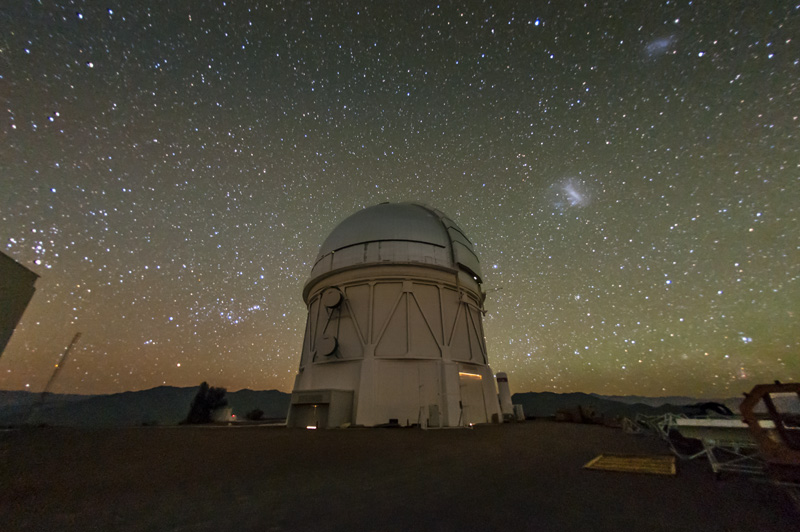
The Dark Energy Survey utilized the Blanco 4-meter telescope, whose dome is pictured here, located at the National Science Foundation’s Cerro Tololo Inter-American Observatory in the Chilean Andes. Credit: Reidar Hahn, Fermilab
After 25 years of planning, six years of data collection, and six more years of analysis, scientists have published a portion of the final results of the Dark Energy Survey (DES) — the largest, most comprehensive survey of its kind — yielding the tightest constraints to date on models of our universe’s expansion. That expansion is currently accelerating, an effect astronomers ascribe to an unknown force they call dark energy.
The paper, submitted to Physical Review D, is a summary of the findings from 18 papers authored by over 100 scientists on the survey’s Year 6 (Y6) results. From 2013 to 2019, the international DES Collaboration used the National Science Foundation’s Victor M. Blanco 4-meter telescope in Chile to observe 669 million galaxies across one-eighth of the sky over the course of 758 nights. Since 2019, the collaboration has steadily analyzed the data and released their results, starting in 2019 with the Year 1 (Y1) results, followed in 2021 with the Year 3 (Y3) results, and culminating with the newly released Y6 results.
The survey is the first to investigate dark energy by combining observations from four different probes to gather the most comprehensive data to date on the way our cosmos has expanded over time. In the paper, the DES Collaboration presents the first full analysis of all six years of data from two of the four probes — weak lensing and galaxy clustering — along with the first results from the combined analysis of all four probes. The results align most closely with the Lambda Cold Dark Matter (ΛCDM) model of cosmology — the leading model for explaining the expansion of our universe.
“This is the … final legacy analysis from DES using all the data from contributions from over 400 people. … We have fulfilled its promise from 20 years ago, and the result is something history should remember,” Masaya Yamamoto, postdoctoral researcher at Princeton and member of the DES shear measurement/calibration analysis team, tells Astronomy.
A multi-probe approach
The DES is the largest survey in history to study the effects of what astronomers call dark energy. First imagined 25 years ago, the DES is a massive collaboration of over 400 scientists from all around the world. What makes DES so unique is its approach to studying dark energy.
To investigate the expansion of the universe and the evolution of cosmic structures, DES combines data from four distinct probes. Baryonic acoustic oscillations (BAO) are patterns imprinted by early cosmic sound waves; today, astronomers can use them to map the universe’s expansion. Type Ia supernovae, which have uniform brightness, act as so-called standard candles, so their brightness with distance can be used to track the acceleration of the cosmos’ expansion. Weak gravitational lensing maps the universe’s mass by measuring how dark matter distorts light as it travels to us from distant galaxies. And analyzing the distribution of galaxies and where they cluster also allows astronomers to understand how matter is distributed throughout the universe.
RELATED: New dark matter map shows the universe in detail
The newly released results represent the first full analysis of the data gathered from galaxy clustering and weak lensing, along with the first results to combine data from all four probes. According to Yamamoto, what’s most remarkable about the findings is that across these four separate probes, they give a consistent picture of our cosmos. “It’s completely possible that one probe can say something different about our universe compared to other probes,” Yamamoto says. “The fact that everything is consistent together is amazing.”
An expanding universe
In 1929, Edwin Hubble showed that the universe was expanding. Then, in 1998, scientists discovered the expansion was accelerating. That acceleration was pinned on an invisible force known as dark energy.
Modern cosmological models are theoretical frameworks that seek to explain the universe we live in by mathematically expressing the relationship between different properties, including the amount of normal matter, dark matter, and dark energy. Within the models, these properties are called cosmological parameters.
In ΛCDM, dark energy exists at a constant density throughout the universe and over time. There are other models, such as wCDM, where the density of dark energy changes over time, and w0waCDM, where the density of dark energy changes over time and the rate of that change also changes.
With surveys like DES, scientists test these cosmological models against real-world measurements of their parameters. And ever-more-precise measurements better allow astronomers to differentiate between various models. “We can test for what values of parameters produce theory predictions that agree the best with our measurements, and how much those values can change before predictions disagree significantly with the observables,” explains DES team member Jessie Muir, a physics professor at the University of Cincinnati. “In other words, we’re constraining what parameter values plausibly describe the real universe.”
The current results test measured parameters against the ΛCDM and wCDM models. Depending on the model, “for this DES analysis, we consider either six or seven cosmological parameters … and a few dozen other parameters which capture information about the astrophysics relating those physical properties to our observables and measurements of them,” says Muir.
Pinning down the parameters
The new DES results place tighter constraints on the parameters of ΛCDM and wCDM. The results align with both models and don’t necessarily show a preference for one model over the other.
Specifically, the data pinned down exactly how much of the universe is made of dark energy (a parameter identified as ΩΛ in both models). While the two models have different theories about dark energy’s density over time, they both rely on a so-called flat universe where the total energy budget must add up to 100 percent. By measuring that matter takes up about 30.2 percent of the universe, the data thus constrain ΩΛ to 69.8 percent.
According to Yamamoto, this result is one of “the most precise measurements of dark energy” ever recorded.
The survey also narrowed the range for w, which tells us whether dark energy is a steady force or one that shifts over time. In ΛCDM, where dark energy is constant over time, w has a value of exactly -1. The DES results find a value for w of –1.12, with a margin of error of +0.26 and –0.20, meaning w is between –1.32 and –0.8. This measurement has a 68 percent confidence level, meaning there is a good chance the true value falls within this margin.
While being so close to –1 strongly suggests dark energy is constant and ΛCDM is the correct model, the result is still a narrow range rather than a single point. This means that while a constant force is the most likely candidate, the data don’t entirely rule out the possibility that dark energy’s density could change as the universe ages.
The clumpiness mystery
While the majority of DES data support ΛCDM, there was one small outlier that emerged. It is a parameter called S8, which tracks how “clumpy” the universe has become as gravity pulls matter together.
While matter in the early universe was much more uniform, denser regions grew over billions of years under the influence of gravity to form the large-scale structures we see today. By comparing the later universe to predictions for how current cosmos should look based on measurements of tiny density differences in the cosmic microwave background (CMB) produced about 380,000 years after the Big Bang, scientists are testing the models’ ability to describe “the evolution of structure across 14 billion years of cosmic history. This is why we’re interested in this kind of comparison!” Muir says.
S8 describes how dramatically the density of matter varies across the universe, Muir explains. “Higher values of S8 mean a clumpier universe, lower values mean matter is distributed more uniformly.”
The new paper gives a value for S8 of 0.789, with a margin of error of +0.012 and –0.012, a result twice as precise as the previous Y3 analysis. This number is slightly lower than what is predicted by the CMB — a constant finding even in previous DES measurements, Muir notes. This discrepancy, known as the S8 tension, “[indicates] we find matter to be a little less clustered than what we would expect given CMB observations and the predictions of ΛCDM,” Muir says.
Yamamoto notes that while the difference represents a potential mystery, “this gap is not large to begin with.” It still falls below the significance threshold where scientists would consider it a significant issue. And while the new DES data is twice as precise, Yamamoto explains that the Y6 results “did not shrink or widen this gap,” which remains exactly where it was before.
The road ahead
Both Yamamoto and Muir state that even though the survey has come to a close, the work is far from over. In addition to current models, the DES team will continue to compare the data against the more complex w0waCDM model. Looking further ahead, the dark energy road leads to the Vera C. Rubin Observatory.
RELATED: Here are the first-ever images released by the Vera C. Rubin Observatory
Muir explains that Rubin “will significantly increase the statistical precision of measurements” by imaging more of the sky and seeing fainter galaxies. “This is exciting because more precise measurements mean we can be more sensitive to signals of dynamic dark energy or other cosmological physics,” Muir says. “It also presents a challenge in making sure our measurement and analysis methods are robust and accurate enough to take as much advantage of that precision as possible.”
Yamamoto agrees that the statistical power of the next generation of surveys will be “huge compared to DES,” but emphasizes that the work done now has paved the way for these future missions. “A lot of new tools that we implemented in the final DES analysis were actually developed for Rubin and applied under DES real data for the first time,” Yamamoto says.The insights gained from its final analysis can then be applied to surveys taken with Rubin and the Euclid and Nancy Grace Roman space telescopes. “Basically, DES set the groundwork.”
A human legacy
Beyond the data, both scientists emphasize that one of the survey’s most enduring legacies is the human one. Muir, who says she has been active in the collaboration since she was a graduate student in 2016, notes that this was a “huge collaborative effort by an international team,” where key portions of the study were spearheaded by early-career researchers and doctoral students. Throughout the survey’s 20-year history, “one of the key accomplishments of this effort has been the role the work has had in training a generation of scientists,” Muir says.
Yamamoto, who also began his career within the collaboration, points out that many researchers have effectively “grown up in DES” before moving on to faculty positions worldwide. For Yamamoto, watching this global network “using what they have learned in DES is just amazing.”